Effect of Consumption of Functional Foods Consisting of High-Oleic Canola Oil, Docosahexaenoic Acid and Barley β-glucan on Plasma Lipids, Blood Pressure, and Framingham Risk Score in Human Population with Metabolic Syndrome: A Randomized Crossover Trial
Abstract
Functional foods such as high-oleic canola oil, omega-3 oils and barley β-glucan, have individually been shown to improve blood lipid profiles. The objective of the study was to test the synergistic effect of consuming a combination of novel foods with functional ingredients on blood lipid profile, blood pressure, and the Framingham risk score. A randomized single-blinded free-living crossover study design was used. The study involved thirty-five participants and consisted of four intervention phases, (1) muffins and cookies containing all-purpose flour and 50g/day of a blend of sunflower oil, safflower oil, and butter as a control oil; (2) barley flour with 4.36g/day of HMW-BBG and 50g/day of a blend of sunflower oil, safflower oil, and butter as control oil; (3) all-purpose flour, and 50g/day HOCO-DHA (85:15 DHA oil consists of 40% DHA) (DHA dosage 3g/day) and (4) a combination of barley flour with 4.36g/day, HMW-BBG and 50g/day of HOCO-DHA. The control oil used in the study represented a typical western dietary fat intake of four weeks duration, each intervention phase separated by a four-week washout period. Participants consumed test products of one muffin and two cookies. The combination of high-oleic canola oil, omega-3 oils and barley β-glucan showed an increase in high-density lipoprotein levels (HDL-C) (P< 0.05), a decrease in triglyceride levels (TG) (P< 0.05), decrease in very low-density lipoprotein levels (VLDL-C) (P< 0.05), total cholesterol to high-density lipoprotein ratio (TC:HDL-C) (P< 0.05) and diastolic blood pressure (DBP) (P< 0.05) at endpoint when compared to the control. No significant differences were observed for total cholesterol (TC) (P< 0.05), low-density lipoprotein level (LDL-C) (P<0.05), glucose level (P< 0.05) or systolic blood pressure (SBP) (P< 0.05). The combined treatment when compared to control at end point for the Framingham risk score was decreased for both males and females (P< 0.05). At endpoint, the high-oleic canola docosahexaenoic acid treatment showed an increase in high-density lipoprotein levels (P< 0.05), a decrease in triglyceride levels (P< 0.05), decrease in very low-density lipoprotein levels (P< 0.05), total cholesterol to high-density lipoprotein ratio (P< 0.05) and diastolic blood pressure (P< 0.05) when the high-oleic canola docosahexaenoic acid treatment was compared to the control. We conclude that the combination of high-oleic canola oil, omega-3 oils and barley β-glucan did not show a synergistic effect on the outcomes measured.
Introduction
Cardiovascular disease (CVD) risk factors are mainly associated with diets high in saturated fats and unhealthy lifestyle, leading to increased morbidity and mortality (Mertens et al 2017). Dietary portfolios using a combination of cholesterol-lowering foods offer additional positive outcomes compared to conventional dietary interventions in reducing serum cholesterol concentrations (AbuMweis et al 2010B, De Natale et al 2012, Jenkins et al 2011). However, the question remains whether the combination approach results in a synergistic or additive effect. Functional foods ingredients such as high-oleic canola oil (HOCO) (Gillingham et al 2011, Jones et al 2014, Senanayake et al 2014), omega-3 oils (Kelley et al 2007) and barley β-glucan (Behall et al 2004, Keenan et al 2007, Wang et al 2016) have been individually shown to improve blood lipid profiles. The canola multicentre trial (COMIT) study showed that a diet consisting of a combination high-oleic canola oil and docosahexaenoic acid (DHA) lowered high-density lipoprotein cholesterol (HDL-C) by 3.5%, triglyceride (TG) by 20%, systolic blood pressure (SBP) by 3.3% and showed a decrease in the ten-year Framingham risk score (FRS) (-19.0 ± 3.1%; P<0.001) when contrasted with other treatment diets, thereby lowering the CVD risk (Jones et al 2014, Senanayake et al 2014). The Omni-Heart Trial used a diet with 21% of energy from monounsaturated fatty acid (MUFA) and 10% from polyunsaturated fatty acids (PUFA). Results indicated a decrease in low-density lipoprotein cholesterol (LDL-C), blood pressure (BP) and CVD risk when compared to a higher carbohydrate diet (Swain et al 2008). The beneficial effects of n3 fatty acids on CVD risk reduction included modifying lipid profiles, reducing heart rate, reducing BP levels, improving endothelial function, improving arterial compliance, and alleviation of inflammatory responses (Bradberry and Hilleman 2013, Egert et al 2009, Skulas-Ray et al 2011). The omega-3-rich phase in the COMIT study at baseline showed a decrease in SBP by 3.3% when compared to other dietary treatments (Gillingham et al 2011, Senanayake et al 2014). A meta-analysis of 47 clinical studies and demonstrated the TG lowering effects of DHA on subjects with CVD when compared to the placebo group (Skulas-Ray et al 2011). The meta-analysis of eleven clinical trials showed that an intake of a minimum of 3g/d β-glucan soluble fibre from barley/oat grain products can reduce blood cholesterol concentrations (Summary 2012). In 1997, the US FDA approved a health claim for β-glucan soluble fibre from oats for reducing plasma cholesterol levels and risk of heart disease (US FDA 2006). AbuMweis et al (2010B) conducted a meta-analysis of randomized crossover trials to determine the effects of dietary consumption of BBG on serum cholesterol concentrations. Findings of the study indicated a 0.30mmol/L reduction in LDL-C levels after consuming BBG for four weeks when compared to control. The lipid-lowering effect of BBG suggested that an intake of 3g/day of BBG reduces serum blood concentrations of total and LDL-C levels. Following the positive outcome Health Canada in 2012 issued a health claim for BBG indicating that one gram which equals 35% of the recommended intake reduces blood cholesterol (AbuMweis et al 2010B). It is now recognized that the physicochemical properties of β-glucan, including molecular weight and viscosity, may play a role in the cholesterol-lowering effect of β-glucan (Lan-Pidhainy et al 2007, Vuksan et al 2011). Significant reductions were seen in serum TC and LDL-C levels with 3g/d high molecular weight barley β-glucan (HMW-BBG) in mildly hypercholesterolemic subjects (Behall et al 2004).
Taking into consideration the above-mentioned positive factors, the objective of this study was to test the effect of combining HOCO, DHA and HMW-BBG on blood lipid profiles, blood pressure and FRS in terms of observing a synergistic effect. This is the first study to test the effects of a combination of HOCO, DHA and HMW-BBG on CVD risk. It was hypothesized that this combined treatment for four weeks will lead to additional positive outcomes on blood lipids, blood pressure and FRS when compared to their consumption individually.
Materials and Methods
Study Design
The HOCO, DHA and HMW-BBG study was a randomized single blinded free-living crossover trial conducted at the Richardson Centre for Functional Foods and Nutraceuticals (RCFFN). This was a seven-month study with four treatment phases, each 28 days in length separated by a four-week washout period. Prior to the commencement of the study as per protocol, each participant was required to be examined by a study physician. Participants then consumed one test muffin and two test cookies which were packed for consumption at home. Institutional research ethics boards reviewed and approved the study protocol. Trial registration can be viewed at www.clinicaltrials.gov with ID NCT-02091583 PROTOCOL NO: B2014:029. The trial protocol and study design has been published in Journal of Biomed Central. https://doi.org/10.1186/s13063-015-1014-5. All participants provided written informed consent as prescribed by the research ethics board.
Eligibility Criteria and Subject Selection
Study advertisements used local media including newspapers, the official website of RCFFN, university campus, and a pre-existing database of participants. The eligibility criteria included age: 18-70 years, body mass index: >25kg/m2, waist circumference: men: >94cm, women > 80cm. Individuals with at least two of the following criteria were accepted into the study: i) TG >1.7mmol/L; ii) HDL-C <1mmol/L for male and <1.3mmol/L for female; iii) fasting glucose >5.6mmol/L iv) LDL -C >2.7mmol/L and v) blood pressure >130/100. The exclusion criteria included: (i) participants consuming lipid lowering medications or nutritional supplements known to affect blood lipids, or having any dietary restrictions that would prevent them from consuming the study diet for 28 days, (ii) participants with current or history of any diseases and disorders that could interfere with fat absorption, (iii) participants planning to conceive during the study period, (iv) smoking or people consuming more than one alcoholic drink per day or history of alcoholism or drug dependence, or (v) people having consumed any experimental medication within one month before screening or as concomitant medications. Twelve-hour fasting blood samples were collected on days one, two, 29 and 30 to test lipid profiles. The main outcome measures were serum lipid variables, including TC, LDL-C, HDL-C, TG, and VLDL-C concentrations. Blood samples were centrifuged at 3000rpm for 20min at 4°C, and were separated to yield serum, plasma, and RBC, and then stored at -80°C until analysis. Monitoring of blood pressure, body weight, and waist circumference was done at the beginning and at the end of each treatment period. Three measurements were taken and the average of the three was calculated. Whole body dual-energy x-ray absorptiometry (DEXA) scan (Lunar Prodigy Advance, Lunar Corp., Madison WI) was conducted to determine changes in body fat composition at the end of each treatment phase.
Study Diets
Thirty-five participants were randomly assigned to each of the four treatments from January 2015 to November 2015.The randomized and recruited participants consumed one muffin along with the breakfast at the centre and the two cookies were packed for consumption later in the day. There were two flavours of muffins (pumpkin spice and vanilla) and three flavours of cookies (cocoa, lemon and ginger). The flavours of the muffins and cookies were provided in rotation with equal numbers of days per flavour during each treatment period. For the weekend, the muffin and cookies were packed and given on Friday. There was minimal control over the background diets of the participants. The dietitian provided individualized dietary recommendations based on the Canada’s Food Guide according to his/her energy requirements before the commencement of the study. Almost 50% of the treatments consumed were under supervision to ensure optimal compliance. Participants were instructed to restrict their intake of fish or seafood products. A three-day food record was collected at the beginning and end of each treatment phase. Participants were strongly advised to maintain consistency in their dietary intake, physical activity patterns as well as body weight during the experimental period. Recruited participants were randomly assigned to one of the treatment sequences using a Latin square design. The nutrient compositions of the muffins and cookies for the different treatments of the study are listed in Tables 1 and 2 respectively. The four treatments were as follows: (1) muffins and cookies containing all-purpose flour and 50g/day of a blend of sunflower oil, safflower oil, and butter as a control oil. (2) barley flour with 4.36g/day of HMW-BBG and 50g/day of a blend of sunflower oil, safflower oil, and butter as a control oil. (3) all-purpose flour and 50g/day HOCO-DHA (85:15 DHA oil consists of 40% DHA) (DHA dosage 3g/day) and (4) combination of barley flour with 4.36g/day, HMW-BBG and 50g/day of HOCO-DHA. The control oil used in the study represented a typical western dietary fat intake. The control treatment was composed largely of saturated fat with substantial levels of n-6 linoleic acid as seen commonly in North American diets. Dosages for HOCO-DHA and HMW-BBG were determined based on previous clinical studies done by our research group (AbuMweiss et al 2010B, Gillingham et al 2011). The most common procedure of analysis is to perform a separate calculation based on target effect sizes for each of the interventions compared with their respective controls.
The set of four treatments was analyzed using a 2×2 factorial design, which represents two factors (oil and flour) each at two levels. The two levels of oil were control oil and HOCO-DHA, and the two levels of flour were control flour and HMW-BBG. The effects investigated by this design were the two main effects of the two factors and their interaction effect. A factorial design is an efficient way for exploring the effects of oil and flour in the treatments we used in our study. This trial design is useful to detect a link between factors while reducing the possibility of experimental error or confounding variables. It also highlights the relationships between factors, allowing the effects of manipulating a single factor to be isolated and analyzed singly. The purposes of a factorial design are (i) to attain information on the average effects of all the factors from a single experiment of moderate size, (ii) to expand the basis of inferences on one factor by testing it under varied conditions of others, and (iii) to assess the way the effects of factors interact with one another. Here is an example that used a 2×2 factor experiment to study the effects of two factors theobromine and cocoa on blood lipids. Their analysis showed a significant main effect of theobromine on HDL-C (P<0.05) but not cocoa, and no significant interaction effect (Neufingerl et al 2013). The HOPE-3 trial is another example using a 2×2 factorial trial showed the significant effect of the rouvastatin group on lowering risk of CVD events (P<0.05) but not candesartan + hydrochlorothiazide and no interaction effect was seen (Yusuf et al 2016). These two examples of factorial analysis illustrate how the effects of individual factors and their interaction can be studied.
Muffin and cookie recipes were developed in the Agriculture and Agri-Food Canada laboratories and at the RCFFN metabolic kitchen. Alberta Barley Commission provided the barley grain (cultivar CDC Rattan) and milled this grain into whole grain flour at the Canadian International Grains Institute, Winnipeg. The cultivar CDC Rattan was selected based on the β-glucan content and because CDC Rattan is a popular food barley variety in western Canada. All-purpose flour (Robin Hood) was purchased from the local supermarket. Richardson Oilseed Limited provided the HOCO. The DHA oil was purchased from DSM Nutritional Products (Ayr, ON, Canada). Macronutrients, including protein, carbohydrates, and fibre content of the foods, were analyzed at the Agriculture and Agri-Food Canada laboratories, RCFFN, Winnipeg, Canada. Total fat and fatty acid profiles of the foods were measured at the RCFFN laboratories Winnipeg, MB, Canada. The macronutrient contents of treatment foods were similar between different treatments and there were no differences in nutritional values between different flavours of muffins or cookies.
Sample Collection and Analysis
Twelve-hour fasting blood samples were collected on days one, two, 29 and 30 of each intervention phase. Participants were advised to fast for 12 hours and not consume any alcoholic beverages for at least 48 hours before blood collection. Participants were instructed to refrain from engaging in intense physical activity for at least 24 hours before each visit. To determine participant compliance, on the days of blood collection, a medical questionnaire was filled to record their 12-hour diet, 48-hour alcohol consumption, and 24-hour physical activity patterns. Blood samples were centrifuged at 3000rpm for 20 minutes at 4°C. Aliquots of samples yielded serum, plasma EDTA and heparin, and red blood cells (RBC) EDTA and heparin and stored at −80°C until analysis.
Lipid Profile and Framingham Risk Score Analysis
Analysis of plasma samples for lipid profiles including TC, HDL-C, TG, LDL-C, VLDL-C and glucose levels were performed utilizing robotized enzymatic routines on Vitros 350 Chemistry System (Ortho-Clinical and Diagnostics, Johnson and Johnson). For the analyses, 0.5ml of plasma heparin sample was used to measure the lipid profile. The system was initially calibrated for each parameter and then measured using Calibrator Kit 1 (glucose), Calibrator Kit 2 (TC, TG, LDL-C) and Calibrator Kit 25 (HDL-C). This was followed by using Performance Verifier 1 and 2 to check for the value of each parameter in the given ranges as prescribed online. The Performance Verifier was run every eight hours to ensure accuracy in results. Serum LDL-C concentrations were estimated using the Friedewald formula (LDL-C = TC – HDL-C – TG/5) (Friedewald et al 1972). FRS 10-year CHD risk score was estimated by FRS online calculator based on age, sex, SBP, TC, and HDL-C values of each participant at the end of each dietary phase (D’Agostino et al 2008). Blood pressure was measured using a digital sphygmomanometer. Readings were averaged at 10, 13 and 16 minutes.
Statistical Analysis
Statistical analysis of the effects of the treatments on the lipid profile, Framingham risk on serum cholesterol concentration was tested using SAS (version 9.4; SAS Institute, Inc., Cary, NC, USA). A power calculation indicated that a minimum of 35 participants was necessary to detect an interaction effect in LDL-C concentrations of 0.43mMol/L with a standard deviation of 0.13mMol/L in a 2×2 factorial full design, 2-sided testing with alpha = 0.05 and power = 0.8. To allow for a dropout rate of 20%, the desired sample size was increased to 28. The mixed model procedures in SAS (Proc mixed in version 9.4) were used with treatment, sequence, phase, and gender considered as fixed effects, whereas subject/participant was added as a random effect in the model. Treatment effects in the model were analyzed as a factorial set with the two factors, Oil type and Flour type and their interaction. The purpose of analyzing treatment effects as a factorial is to dissect the factorial effects of oil with two levels (Control and HOCO-DHA), flour with two levels (Control and BBG) and their interaction. The normality of distribution of data was determined by a Shapiro-Wilk test, and the non-normal variables were normalized by identifying the outliers from the studentized residual effect before comparisons with other treatments. Results for treatments in the text and figures are expressed as least-squares means and their standard errors from the model described above, unless stated otherwise. Multiple comparison of treatment means was carried out using Tukey’s test with a type I error of 0.05.
Results
Baseline Characteristics and Treatment Differences
Thirty subjects completed all four treatment periods. Seven participants were excluded from the study. Four dropped out during the study due to low tolerance to the test products. One was assessed as non-compliant during the study and the remaining two individuals were found to be non-compliant based on lab and statistical analysis and were excluded. Twenty-eight participants’ data were finally analyzed (Figure 1). No statistically significant differences were observed for subjects across treatments, age, BMI, TC, glucose, LDL-C, HDL-C, TG, body weight, waist circumference, SBP and DBP at baseline as seen in Table 3.
Effect of Treatment on Lipid Profile and Blood Pressure
At endpoint, the HOCO, DHA treatment showed an increase in HDL-C (P< 0.05) and a decrease in TG (P< 0.05) when compared to control. We also observed a decrease in VLDL-C (P< 0.05), TC:HDL-C (P< 0.05) and DBP (P< 0.05) in the HOCO, DHA treatment when compared to the control. The combination of HOCO, DHA and HMW-BBG showed an increase in HDL-C (P< 0.05) and a decrease in TG (P< 0.05) when compared to control. The combination of HOCO, DHA and HMW-BBG also showed a decrease in VLDL-C (P< 0.05), TC:HDL-C (P< 0.05) and DBP (P< 0.05) at endpoint when compared to the control. No significant differences were observed for TC, LDL-C, glucose level and SBP Table 4. Between treatments, the HOCO DHA treatment was significantly different (P<0.05) when compared to HMW-BBG treatment for TG, HDL-C, VLDL-C, TC:HDL-C and DBP. Similarly, the combined HOCO, DHA and HMW-BBG treatment was significantly different (P<0.05) when compared to HMW-BBG treatment for TG, HDL-C, VLDL-C, TC:HDL-C and DBP. At endpoint, in a 2×2 factor analysis, there was a significant main effect on the HDL-C, VLDL-C, TC:HDL-C, TG and DBP, shown for HOCO DHA oil factor (P< 0.05) but not for the HMW-BBG factor. There was no significant interaction effect between HOCO, DHA and HMW-BBG on any of the lipid parameters (P>0.05) as shown in Table 5. At endpoint the combination of HOCO, DHA and HMW-BBG was also able to show an overall decrease in FRS for both males and females when compared to the control (P<0.05) (Figure 2). Between treatments there were no significant differences.
Discussion
The purpose of this study was to evaluate the effect of combining functional ingredients HOCO, DHA and HMW-BBG on blood lipid profiles and FRS in a population with MetS. After a four-week treatment period the combination of HOCO, DHA and HMW-BBG improved HDL-C, lowered TC: HDL-C ratio, TG, VLDL-C and DBP as well as showed an overall decrease in FRS for both males and females when compared to the control. The overall significant decrease in cholesterol FRS for the combined treatment was observed because of increased HDL-C concentrations and a decrease in blood pressure. However, cholesterol FRS changes in other and between treatments were not significantly different. Based on previous literature, decreases in blood pressure are identified to be related to changes in vascular function, indicating that blood pressure measurements were conducted in a consistent manner. Understandably, the HOCO-DHA treatment also showed an increase in HDL-C, decrease in TC: HDL-C ratio, TG, VLDL-C and DBP when compared to control. Some of the results of the study are consistent with the COMIT trial, where the HOCO-DHA was the only diet that increased HDL-C, as well as produced the greatest reduction in TG and lowered SBP and DBP when compared with the other diets (Gillingham et al 2011). The TC: HDL-C ratio is also a strong predictor of CVD risk. Owing to the disproportion between the atherogenic cholesterol carrier and the protective lipoproteins cholesterol carrier, individuals with a higher TC: HDL-C ratio have greater CVD risk (Lutjohann et al 2002). The HMW-BBG individual treatment showed no significant effects when compared to control. The AHA guidelines recommend 2-4g/d fish oil supplement daily for individuals at risk for CVD (Lutjohann et al 2002). Effect of dose response studies showed that 3g/d of DHA was capable of lowering TG levels whereas dosages as low as 0.85g/d did not. The dose of DHA (3g/d) used in the current study was based on the recommended range for TG lowering, to evaluate individuals with CVD risk factors (Skulas-Ray et al 2019). Serum LDL-C tended to decrease after the consumption of the combination of HOCO, DHA and HMW-BBG, however, this reduction was not statistically significant. Omega-3 fatty acid studies have shown that the TG lowering effect occurs with an increase in LDL-C concentration (Teunissen et al 2001). The theory is that the intake of DHA based on previous literature could have resulted in an increase in LDL-C while lowering TG. At the same time the effect of HMW-BBG could have resulted in lowering of LDL-C. The increase in LDL-C could have thus blunted the effect of HMW-BBG, as seen in previously conducted trials. As a result of this push-pull mechanism, these combined actions may have led to no change observed for LDL-C. The main objective of this study was to determine the efficacy of functional ingredients of HOCO, DHA and HMW-BBG combined into a single food format and observe whether a synergistic effect exists on blood lipids and FRS. Our findings show that the significant effects of the combined HOCO, DHA and HMW-BBG treatment seen in the lipid profile and FRS were not over and above the individual treatment effect sizes, indicating that despite the positive outcomes of combining HOCO, DHA and HMW-BBG they had no overall synergistic impacts.
In conclusion, despite the overall positive outcome, the combination of HOCO, DHA and HMW-BBG had no significant synergistic effect on circulating cholesterol levels or FRS during the 28-day intervention period. The evidence clearly outlines the need to find an acceptable dosage of oil to match with 3g/d HMW-BBG in order to achieve the targeted goals or preliminary screening of the right genotype that could provide better clinical outcomes.
Acknowledgements and Statement of Conflict of Interest
The authors would like to acknowledge RCFFN for conducting the clinical trial. Thanks to the Alberta Barley Commission for providing the barley grain. The Canadian International Grains Institute is acknowledged for milling the barley grain to whole grain flour. The authors are also thankful to the Richardson Oilseed Limited for providing the HOCO. The funding support for the study was provided by CIHR and has no bearing in defining the study design, data collection, analysis, interpretation of data, in the writing of the manuscript and in the decision to submit the manuscript for publication. We thank Camille Rhymer, Tracy Exley, and Kim Kuzminski, Agriculture and Agri-Food Canada, for their help with food development and nutrient analysis of the study foods. We also thank the participants for their willingness to take their time out to be a part of the study. The authors are also thankful to Dr. Peter Sujith and Dr. Dylan Mackay for their technical expertise and Dr. Gary Crow for his expertise with the statistical analysis. The authors declare no conflict of interests.
References
AbuMweis SS, Jew S, Ames NP. β-glucan from barley and its lipid-lowering capacity: a meta-analysis of randomized, controlled trials. Eur J Clin Nutr. 2010A Dec;64(12):1472-1480.
AbuMweis SS, Jew S, Jones PJ. Optimizing clinical trial design for assessing the efficacy of functional foods. Nutr Rev. 2010B Aug;68(8):485-499.
Behall KM, Scholfield DJ, Hallfrisch J. Lipids significantly reduced by diets containing barley in moderately hypercholesterolemic men. Journal of the American College of Nutrition. 2004 Feb 1;23(1):55-62.
Bradberry JC and Hilleman DE. Overview of omega-3 Fatty Acid therapies. P T. 2013 Nov;38(11):681-691.
D’Agostino RB Sr, Vasan RS, Pencina MJ, Wolf PA, Cobain M, Massaro JM, Kannel WB. General cardiovascular risk profile for use in primary care: the Framingham Heart Study. Circulation. 2008 Feb 12;117(6):743-753.
De Natale C, Minerva V, Patti L, Mazzarella R, Ciano O, Maione S, Luongo D, Naviglio D, Marotta G, Turco S, Ciati R, Melegari C, Rivellese AA, Riccardi G. Effects of baked products enriched with n-3 fatty acids, folates, β-glucans, and tocopherol in patients with mild mixed hyperlipidemia. J Am Coll Nutr. 2012 Oct;31(5):311-319.
Egert S, Kannenberg F, Somoza V, Erbersdobler HF, Wahrburg U. Dietary alpha-linolenic acid, EPA, and DHA have differential effects on LDL fatty acid composition but similar effects on serum lipid profiles in normolipidemic humans. J Nutr. 2009 May;139(5):861-868.
Friedewald WT, Levy RI, Fredrickson DS. Estimation of the concentration of low-density lipoprotein cholesterol in plasma, without use of the preparative ultracentrifuge. Clin Chem. 1972 Jun;18(6):499-502.
Gillingham LG, Gustafson JA, Han SY, Jassal DS, Jones PJ. High-oleic rapeseed (canola) and flaxseed oils modulate serum lipids and inflammatory biomarkers in hypercholesterolaemic subjects. Br J Nutr. 2011 Feb;105(3):417-427.
Jenkins DJ, Jones PJ, Lamarche B, Kendall CW, Faulkner D, Cermakova L, Gigleux I, Ramprasath V, de Souza R, Ireland C, Patel D, Srichaikul K, Abdulnour S, Bashyam B, Collier C, Hoshizaki S, Josse RG, Leiter LA, Connelly PW, Frohlich J. Effect of a dietary portfolio of cholesterol-lowering foods given at 2 levels of intensity of dietary advice on serum lipids in hyperlipidemia: a randomized controlled trial. JAMA. 2011 Aug 24;306(8):831-839.
Jones PJ, Senanayake VK, Pu S, Jenkins DJ, Connelly PW, Lamarche B, Couture P, Charest A, Baril-Gravel L, West SG, Liu X, Fleming JA, McCrea CE, Kris-Etherton PM. DHA-enriched high-oleic acid canola oil improves lipid profile and lowers predicted cardiovascular disease risk in the canola oil multicenter randomized controlled trial. Am J Clin Nutr. 2014 Jul;100(1):88-97.
Keenan JM, Goulson M, Shamliyan T, Knutson N, Kolberg L, Curry L. The effects of concentrated barley beta-glucan on blood lipids in a population of hypercholesterolaemic men and women. Br J Nutr. 2007 Jun;97(6):1162-1168.
Kelley DS, Siegel D, Vemuri M, Mackey BE. Docosahexaenoic acid supplementation improves fasting and postprandial lipid profiles in hypertriglyceridemic men. Am J Clin Nutr. 2007 Aug;86(2):324-333.
Lan‐Pidhainy X, Brummer Y, Tosh SM, Wolever TM, Wood PJ. Reducing beta‐glucan solubility in oat bran muffins by freeze‐thaw treatment attenuates its hypoglycemic effect. Cereal chemistry. 2007 Sep;84(5):512-517.
Lütjohann D, Brzezinka A, Barth E, Abramowski D, Staufenbiel M, von Bergmann K, Beyreuther K, Multhaup G, Bayer TA. Profile of cholesterol-related sterols in aged amyloid precursor protein transgenic mouse brain. J Lipid Res. 2002 Jul;43(7):1078-1085.
Mertens E, Markey O, Geleijnse JM, Givens DI, Lovegrove JA. Dietary Patterns in Relation to Cardiovascular Disease Incidence and Risk Markers in a Middle-Aged British Male Population: Data from the Caerphilly Prospective Study. Nutrients. 2017 Jan 18;9(1):75.
Neufingerl N, Zebregs YE, Schuring EA, Trautwein EA. Effect of cocoa and theobromine consumption on serum HDL-cholesterol concentrations: a randomized controlled trial. Am J Clin Nutr. 2013 Jun;97(6):1201-1209.
Senanayake VK, Pu S, Jenkins DA, Lamarche B, Kris-Etherton PM, West SG, Fleming JA, Liu X, McCrea CE, Jones PJ. Plasma fatty acid changes following consumption of dietary oils containing n-3, n-6, and n-9 fatty acids at different proportions: preliminary findings of the Canola Oil Multicenter Intervention Trial (COMIT). Trials. 2014 Apr 23;15:136.
Skulas-Ray AC, Kris-Etherton PM, Harris WS, Vanden Heuvel JP, Wagner PR, West SG. Dose-response effects of omega-3 fatty acids on triglycerides, inflammation, and endothelial function in healthy persons with moderate hypertriglyceridemia. Am J Clin Nutr. 2011 Feb;93(2):243-252.
Skulas-Ray AC, Wilson PWF, Harris WS, Brinton EA, Kris-Etherton PM, Richter CK, Jacobson TA, Engler MB, Miller M, Robinson JG, Blum CB, Rodriguez-Leyva D, de Ferranti SD, Welty FK; American Heart Association Council on Arteriosclerosis, Thrombosis and Vascular Biology; Council on Lifestyle and Cardiometabolic Health; Council on Cardiovascular Disease in the Young; Council on Cardiovascular and Stroke Nursing; and Council on Clinical Cardiology. Omega-3 Fatty Acids for the Management of Hypertriglyceridemia: A Science Advisory From the American Heart Association. Circulation. 2019 Sep 17;140(12):e673-e691.
Summary of Health Canada’s Assessment of a Health Claim about Barley Products and Blood Cholesterol Lowering. In: Bureau of Nutritional Sciences FD, Health Products and Food Branch, ed. Ottawa, ON: Health Canada. 2012.
Swain JF, McCarron PB, Hamilton EF, Sacks FM, Appel LJ. Characteristics of the diet patterns tested in the optimal macronutrient intake trial to prevent heart disease (OmniHeart): options for a heart-healthy diet. J Am Diet Assoc. 2008 Feb;108(2):257-265.
Teunissen CE, Mulder M, de Vente J, von Bergmann K, De Bruijn C, Steinbusch HW, Lütjohann D. Concentrations of different sterols in the striatum and serum of 3-nitropropionic acid-treated Wistar and Lewis rats. Neurochem Res. 2001 Nov;26(11):1237-1244.
US FDA. CFR 101.81 Health claims: Soluble fiber from certain foods and risk of coronary heart disease (CHD). (2006). Washington, DC: FDA
Vuksan V, Jenkins AL, Rogovik AL, Fairgrieve CD, Jovanovski E, Leiter LA. Viscosity rather than quantity of dietary fibre predicts cholesterol-lowering effect in healthy individuals. Br J Nutr. 2011 Nov;106(9):1349-1352.
Wang Y, Harding SV, Eck P, Thandapilly SJ, Gamel TH, Abdel-Aal el-SM, Crow GH, Tosh SM, Jones PJ, Ames NP. High-Molecular-Weight β-Glucan Decreases Serum Cholesterol Differentially Based on the CYP7A1 rs3808607 Polymorphism in Mildly Hypercholesterolemic Adults. J Nutr. 2016 Apr;146(4):720-727.
Yusuf S, Lonn E, Pais P, Bosch J, López-Jaramillo P, Zhu J, Xavier D, Avezum A, Leiter LA, Piegas LS, Parkhomenko A, Keltai M, Keltai K, Sliwa K, Chazova I, Peters RJ, Held C, Yusoff K, Lewis BS, Jansky P, Khunti K, Toff WD, Reid CM, Varigos J, Accini JL, McKelvie R, Pogue J, Jung H, Liu L, Diaz R, Dans A, Dagenais G; HOPE-3 Investigators. Blood-Pressure and Cholesterol Lowering in Persons without Cardiovascular Disease. N Engl J Med. 2016 May 26;374(21):2032-2043.
Figures and Tables
Table 1
Nutritional Composition of Study Muffins
| Nutritional Component Measurements | Control oil + Control flour | Control oil + HMW BBG | HOCO-DHA + Control flour | HOCO-DHA + HMW BBG |
| Weight (g) | 112 | 108 | 113 | 109 |
| Energy (kcal/kJ)a | 379/1586 | 383/1602 | 379/1586 | 383/1602 |
| Total carbohydrates (g)a | 32.7 | 36.6 | 33 | 36.59 |
| Total proteins (g)a | 8.34 | 8.79 | 8 | 9 |
| Total fibre (g)a | 0.36 | 5.77 | 0.36 | 5.77 |
| β-glucan (g)a | 0 | 2.18 | 0 | 2.18 |
| Total fat (% weight) | 22.5 | 22.9 | 24 | 23 |
| SFA (%) | 33.08 | 35.24 | 13.2 | 14.77 |
| MUFA (%) | 27.93 | 27.16 | 56.71 | 52.44 |
| PUFA (%) | 37.96 | 38.16 | 30.04 | 33.79 |
| n-3 PUFA (%) | 0.86 | 1.01 | 5.59 | 5.64 |
| n-6 PUFA (%) | 37.11 | 37.60 | 24.93 | 27.15 |
Note: DHA docosahexaenoic acid, HOCO high-oleic acid canola oil, MUFA monounsaturated fatty acid, PUFA polyunsaturated fatty acid, SFA saturated fatty acid. Values presented are based on values of the ingredients. Muffins were made with two different flavours: vanilla and spice. Values presented are the average of both the flavours, and there were no major differences between flavours for the measurement. Butter, sunflower and safflower oils (55:20:25) (control oil; 50gm/d) and all-purpose flour. Barley β- glucan (4.3gm/d) and butter sunflower and safflower oils (55:20:25) (control oil; 50gm/d). High-oleic Canola DHA (85:15) (50gm/d, 3gm/d) and butter sunflower and safflower oils (55:20:25) (control oil; 50gm/d) and all-purpose flour. High-oleic Canola DHA (85:15) (50gm/d, 3gm/d) and barley β- glucan (4.3gm/d)
Table 2
Nutritional Composition of Study Cookies
| Nutritional Component Measurements | Control oil + Control flour | Control oil + HMW BBG | HOCO-DHA + Control flour | HOCO-DHA + HMW BBG |
| Weight (g) | 53 | 50 | 52 | 52 |
| Energy (kcal/kJ)a | 213/891 | 221/924 | 213/891 | 221/924 |
| Total carbohydrates (g)a | 23 | 25 | 23 | 25 |
| Total proteins (g)a | 4 | 4 | 4 | 4 |
| Total fibre (g)a | 0.46 | 3.17 | 0.46 | 3.17 |
| β-glucan (g)a | 0 | 1.09 | 0 | 1.09 |
| Total fat (% weight) | 24 | 24 | 24 | 23 |
| SFA (%) | 33.75 | 35.4 | 12.50 | 12.6 |
| MUFA (%) | 31.08 | 29.0 | 63.4 | 64.23 |
| PUFA (%) | 35.2 | 35.7 | 24.13 | 23.20 |
| n-3 PUFA (%) | 0.48 | 0.61 | 6.44 | 6.28 |
| n-6 PUFA (%) | 34.7 | 34.91 | 17.5 | 16.9 |
Note:DHA docosahexaenoic acid, HOCO high-oleic acid canola oil, MUFA monounsaturated fatty acid, PUFA polyunsaturated fatty acid, SFA saturated fatty acid. Values presented are based on values of the ingredients. Cookies were made with three different flavours: cocoa, lemon and ginger. Values presented are the average of both the flavours, and there were no major differences between flavours for the measurement. Butter, sunflower and safflower oils (55:20:25) (control oil; 50gm/d) and all-purpose flour. Barley β- glucan (4.3gm/d) and butter sunflower and safflower oils (55:20:25) (control oil; 50gm/d). High-oleic Canola DHA (85:15) (50gm/d, 3gm/d) and butter sunflower and safflower oils (55:20:25) (control oil; 50gm/d) and all-purpose flour. High-oleic Canola DHA (85:15) (50gm/d, 3gm/d) and barley β- glucan (4.3gm/d).
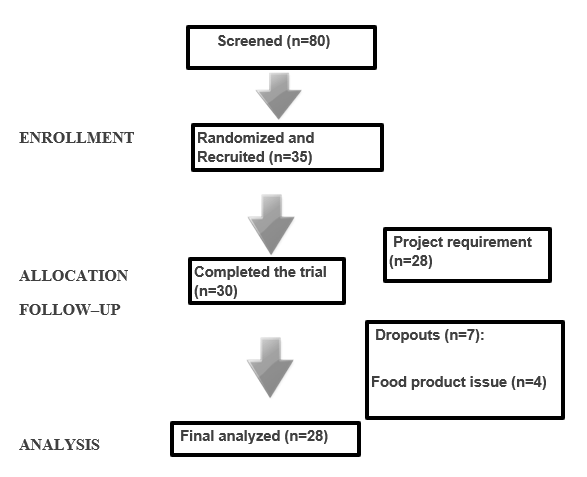
Figure 1.The flow of participants in the CONFIDENCE study. The participant flow through each step of the recruitment, screening and study protocol process at the RCFFN.
Table 3
Baseline Characteristics of Study Participants
| Control oil + Control flour | Control oil + HMW BBG | HOCO-DHA + Control flour | HOCO-DHA + HMW BBG | |
| MALEa (n) | 12 | 12 | 12 | 12 |
| FEMALEa (n) | 17 | 17 | 17 | 17 |
| AGEa (years) | 50 + 2 | 50 + 2 | 50 + 2 | 50 + 2 |
| Bmia (kg/m2) | 31.6 + 5.2 | 31.6 + 5.1 | 31.5 + 5.1 | 31.4 + 5.0 |
| Body Weighta (kg) | 89.3 + 17.1 | 89.1 + 17.2 | 88.8 + 16.7 | 88.5 + 17.1 |
| TCb (mmol/L) | 5.30+ 0.7 | 5.32 + 0.72 | 5.38 + 0.72 | 5.36 + 0.8 |
| LDL-Cb (mmol/L) | 3.31 + 0.66 | 3.23 + 0.56 | 3.33 +0.56 | 3.34 + 0.67 |
| HDL-Cb (mmol/L) | 1.19 + 0.21 | 1.17 +0.22 | 1.21 + 0.22 | 1.17 + 0.2 |
| TGb (mmol/L) | 1.69 + 0.74 | 1.96 + 1.0 | 1.76 + 1.0 | 1.82 + 0.84 |
| VLDLb (mmol/L) | 29.9 + 13.0 | 34.7 + 17.0 | 31.37 + 12.0 | 32.3 + 14.9 |
| Glucoseb(mmol/L) | 5.52 + 0.6 | 5.43 + 0.72 | 5.47 + 0.72 | 5.60 + 0.7 |
| SBPb (mmHg) | 119 + 12.4 | 120 + 14.0 | 118 + 13.9 | 120 + 15.4 |
| DBPb (mmHg) | 79.6 + 8.1 | 81.1 + 8.6 | 80.0 + 8.6 | 79.7 + 7.1 |
Note: Values are representative of subsample of 28 participants (RCFFN) for individual treatment phases with means and their standard deviations.a Anthropometric measurements.b Lipid profile. TC-Total Cholesterol, LDL-C- Low-density lipoprotein cholesterol, DHDL- Direct High-density lipoprotein, TG- Triglycerides, SBP- Systolic blood pressure, DBP- Diastolic blood pressure.
Table 4
Between Treatment Comparisons of Blood Lipid Profile, Blood Pressure Levels
| Control oil + Control flour | Control oil + HMW BBG | HOCO-DHA + Control flour | HOCO-DHA+ HMW BBG | |
| TCb (mmol/L) | 5.40+ 0.14 | 5.26 + 0.00 | 5.39 + 0.13 | 5.20 + 0.15 |
| LDL-Cb (mmol/L) | 3.35 + 0.12 | 3.25 + 0.13 | 3.35 +0.13 | 3.19 + 0.13 |
| HDL-Cb (mmol/L) | 1.20 + 0.03a | 1.18 +0.04a | 1.30 + 0.05b | 1.31 + 0.05bc |
| TGb (mmol/L) | 1.79 + 0.13a | 1.84 + 0.13 a | 1.58 + 0.16b | 1.56 + 0.13bc |
| VLDLb (mmol/L) | 32.4 + 2.5a | 30.7 + 2.1a | 28.5 + 2.8b | 27.3 + 2.3bc |
| TC: HDL-Cb (mmol/L) | 4.54 +0.48 a | 4.53+ 0.15 a | 4.23 + 0.15b | 4.09 + 0.14bc |
| Glucoseb (mmol/L) | 5.49 + 0.10 | 5.40 + 0.11 | 5.71 + 0.17 | 5.63 + 0.15 |
| SBPb (mmHg) | 122 + 3.55 | 118 + 2.75 | 119 + 3.13 | 120 + 2.70 |
| DBPb (mmHg) | 81.0 + 1.81a | 80.0+ 1.50 a | 78.2 + 1.80b | 78.1 + 1.70bc |
| FRS* | 7.77+0.49 a | 7.17+ 0.40 a | 7.04+ 0.49 a | 6.87+ 0.50bc |
Note: Values are representative of subsample of 28 participants (RCFFN) for individual treatment phases with means and their standard errors at endpoint.a Anthropometric measurements.b Lipid profile. TC-Total Cholesterol, LDL-C- Low-density lipoprotein cholesterol, DHDL- Direct High-density lipoprotein, TG- Triglycerides, SBP- Systolic blood pressure, DBP- Diastolic blood pressure. Data at endpoint measurement. Means in a column for a given factor or interaction which do not show a common letter are significantly different (P<0.05). A mixed-model ANOVA and post hoc Tukey’s test was used. Butter, sunflower and safflower oils (55:20:25) (control oil; 50gm/d) and all-purpose flour. Barley β-glucan (4.3g/d) and butter sunflower and safflower oils (55:20:25) (control oil; 50g/d). High-oleic Canola DHA (85:15) (50g/d, 3g/d) and Butter sunflower and safflower oils (55:20:25) (control oil; 50g/d) and all-purpose flour. High-oleic Canola DHA (85:15) (50g/d, 3g/d) and barley β-glucan (4.3g/d). *For FRS the HOCODHA and HMW-BBG treatment is only significantly different from the control oil+ control flour treatment.
Table 5
Factorial Effects and Their Significance for Blood Lipid Profiles and Blood Pressure Levels (P values)
| HMW-BBG | HOCO-DHA | HOCO-DHA + HMW BBG | |
| TCb (mmol/L) | 0.09 | 0.90 | 0.29 |
| LDL-Cb (mmol/L) | 0.06 | 0.63 | 0.61 |
| HDL-Cb (mmol/L) | 0.5 | <0.001** | 0.55 |
| TGb (mmol/L) | 0.48 | 0.01** | 0.81 |
| VLDLb (mmol/L) | 0.38 | 0.00** | 0.82 |
| TC:HDLb (mmol/L) | 0.22 | <0.001** | 0.26 |
| Glucoseb (mmol/L) | 0.91 | 0.10 | 0.60 |
| SBPb (mmHg) | 0.27 | 0.80 | 0.17 |
| DBPb (mmHg) | 0.61 | 0.04** | 0.72 |
Note: Values are representative of subsample of 28 participants (RCFFN) for individual treatment phases. aAnthropometric measurements. b Lipid profile. TC-Total Cholesterol, LDL-C- Low-density lipoprotein cholesterol, DHDL- Direct High-density lipoprotein, TG- Triglycerides, SBP- Systolic blood pressure, DBP- Diastolic blood pressure. Data at endpoint measurement. Means in a column for a given factor or interaction which show** are significant (P<0.05). A mixed-model ANOVA and post hoc Tukey’s test was used. Butter, sunflower and safflower oils (55:20:25) (control oil; 50gm/d) and all-purpose flour. Barley β- glucan (4.3gm/d) and butter sunflower and safflower oils (55:20:25) (control oil; 50gm/d). High-oleic Canola DHA (85:15) (50gm/d, 3gm/d) and Butter sunflower and safflower oils (55:20:25) (control oil; 50gm/d) and all-purpose flour. High-oleic Canola DHA (85:15) (50gm/d, 3gm/d) and barley β-glucan (4.3gm/d).
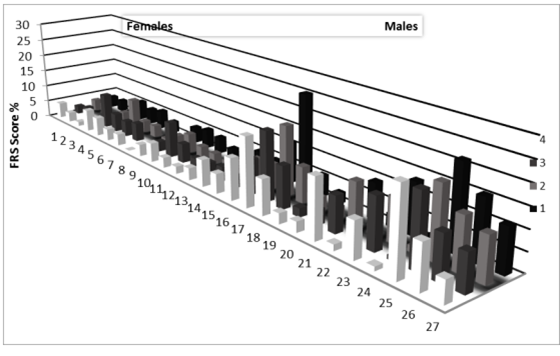
Figure 2: Individual changes for both males and females in Framingham risk score at endpoint. Numbers 1-27 indicate individual participant changes for all four treatments. FRS is calculated for ages 30-100 years, as one participant is below 30 years total number of participants is 27. Females are 1-16 and Males are from 17-27. The legends in numbered format indicate: Treatment 1: Butter, sunflower and safflower oils (55:20:25) (control oil; 50g/d) and all- purpose flour. Treatment 2: Barley β-glucan (4.3gm/d) and butter sunflower and safflower oils (55:20:25) (control oil; 50g/d). Treatment 3: High-oleic Canola DHA (85:15) (50g/d, 3g/d) and butter sunflower and safflower oils (55:20:25) (control oil; 50gm/d) and all-purpose flour. Treatment 4: High-oleic Canola DHA (85:15) (50g/d, 3g/d) and Barley β-glucan (4.3g/d).