Polymorphisms in IRS1 and FABP1 Modify Insulin Resistance in Response to Fatty Acid Composition in Non-Diabetic Subjects With Abdominal Obesity: A Clinical Randomized Trial
Abstract
Background: The prevalence rates of insulin resistance (IR) and its health consequences are increasing worldwide. Emerging evidence suggests a modulatory effect of single nucleotide polymorphisms (SNPs) on IR response to dietary fatty acid (FA) composition; yet, evidence from clinical trials is missing.
Objective: We evaluated the response of IR measures to different levels of dietary FA composition, and the impact of IR-associated genetic polymorphisms on this response.
Methods: Non-diabetic adults (n=116) with abdominal obesity were included in a randomized, controlled-feeding, double-blinded, crossover, multicentre trial. During each phase, participants consumed one of three treatment oils (20% of total fat) for six weeks, separated by a four to 12 week washout. Treatment oils included two-high monounsaturated FA (MUFA) oils, conventional canola or high-oleic acid canola, or a low-MUFA high-saturated FA (SFA) oil blend. Genotyping of nine candidate SNPs was performed using qualitative PCR System.
Results: In the sample as a whole, no differences across the three diets were observed for fasting concentrations of glucose, insulin, and fructosamine, as well as on HOMA-IR or HOMA-β. In the homozygotes of FABP1 rs2241883-CC, but not in other genotypes, reductions in HOMA-IR (p=0.042) and fasting insulin (p=0.06) were observed following consumption of the high-SFA diet compared to the high-MUFA diets. Reductions in insulin (p=0.04), HOMA-β (p=0.02) and HOMA-IR (trend, p=0.07) in the IRS1 rs7578326-GG homozygotes were also observed upon consumption of the high-SFA diet compared to the high-MUFA diets. Polymorphisms within ADIPOQ, ADRB2, FTO, PLIN1, PPARγ, and TCF7L2 genes failed to modulate the effect of MUFA consumption on glucose homeostasis and IR measures.
Conclusion: Dietary FA composition modified IR measures in the carriers of either the FABP1 rs2241883-CC or IRS1 rs7578326-GG genotype. These results may contribute to developing an effective genotype-based dietary recommendation to reduce IR incidence and associated complications.
Key words: monounsaturated fatty acid, fatty acid composition, genotype, gene-nutrient interaction, IRS1, FABP1, glucose, insulin resistance, abdominal obesity.
Introduction
Insulin resistance (IR) increases the risk of type 2 diabetes and several metabolic abnormalities (Qi et al 2011, Riccardi et al 2004). Growing evidence underscores the role of dietary fatty acid (FA) composition in the development of IR (Vessby et al 2001). The quality of dietary fat potentially impacts the efficiency of action of insulin signaling pathways by modifying cellular membrane fluidity and/or increasing intramuscular lipid content (Galgani et al 2008, Lovejoy 2002). Also, dietary fat quality may be involved in IR risk by influencing glucose-stimulated insulin secretion (Vessby et al 2001). Dietary FAs with greater degrees of saturation and/or chain length were suggested to negatively affect the secretion and sensitivity of insulin (Lovejoy 2002, Turner et al 2009). In contrast, monounsaturated FA (MUFA) consumption has been reported to ameliorate IR compared to a saturated FA (SFA)-rich diet in non-diabetic subjects (Vessby et al 2001, Due et al 2008, Errazuriz et al 2017) and carbohydrate-rich diet in diabetic patients (Paniagua et al 2007). Yet, the evidence is inconsistent (Haghighatdoost et al 2012, Xiao et al 2006, Lovejoy et al 2002, Chang et al 2016). Genetic predisposition may contribute to the responsiveness of IR to dietary FA, and therefore, may explain the discrepancies in the available evidence.
Many polymorphisms have been identified to be associated with IR risk, independent of insulin secretion, with an estimated heritability of 60% in familial and twin studies (Fall and Ingelsson 2014, Brown and Walker 2016, Mansego et al 2012). Among the IR-associated genetic variants, those within the insulin receptor substrate-1 (IRS1) gene have garnered more attention. IRS1, encoding a major signaling adaptor protein for insulin, is expressed in insulin-sensitive tissues and plays a pivotal role in insulin-stimulated signaling pathways (Li et al 2016, Alharbi et al 2014). Reductions in the activity and/or expression of IRS1 could contribute to IR and type 2 diabetes (Sesti et al 2001, Zheng et al 2013, Cheng et al 2017). Another candidate gene for IR is FABP1 which encodes the liver fatty acid binding protein and serves as a key regulator of lipid metabolism (McIntosh et al 2014). Polymorphisms that alter the functionality of FABP1 may modify hepatic triglyceride accumulation and FA flux to the liver and, thus, may influence hepatic IR (Mansego et al 2012, Newberry et al 2006). As such, emerging evidence suggests a role of genetics in explaining the action of FA composition in modulating IR (Corella et al 2006, Zheng et al 2015).
Given the increasing prevalence of IR and its metabolic and health consequences worldwide, establishing effective personalized prevention and treatment strategies for IR and its associated metabolic abnormalities requires investigation of the interactions between dietary factors and common genetic variants. Therefore, we hypothesized that polymorphisms within IR-related genes would modulate insulin sensitivity responses to dietary FA composition in subjects with abdominal obesity.
Methods
Study Design and Population
This study was part of the Canola Oil Multi-center Intervention Trial II (COMIT II); a randomized, controlled, double-blinded, crossover study aimed to evaluate the effects of MUFA consumption on body composition and cardiovascular disease-related metabolic responses in individuals with abdominal obesity. Recruitment was conducted from 2014-2016 at four centers including: the Richardson Centre for Functional Foods and Nutraceuticals (RCFFN) at the University of Manitoba in Winnipeg, the Canadian Centre for Agri-Food Research in Health and Medicine (CCARM) at St. Boniface Hospital Albrechtsen Research Centre in Winnipeg, the Institute of Nutrition and Functional Foods (INAF) at Laval University in Québec City, as well as the Department of Nutritional Sciences, The Pennsylvania State University in University Park. Additionally, St. Michael’s Hospital in Toronto participated in sample analyses.
Participants aged 20-65 years were included in the trial if they had abdominal obesity as identified with waist circumference of greater than 94cm for men and 80cm for women, in addition to at least one of the following metabolic syndrome parameters as secondary inclusion criteria: fasting blood glucose of ≥5.6mmol/L (according to the American Diabetes Association definition for pre-diabetes), TG ≥1.7mmol/L, HDL-C <1mmol/L (men) or <1.3mmol/L (women), and blood pressure ≥130mmHg (systolic) and/or ≥85mmHg (diastolic). Individuals were excluded if they had kidney, diabetes, liver, or unstable thyroid disease. Current smokers, pregnant and lactating women, individuals consuming more than two alcoholic beverages per day, individuals taking medication known to affect lipid metabolism for at least the last three months, or individuals who were unwilling to stop taking any supplements for at least two weeks before the study were not eligible to participate. Participants were randomly assigned to one of six treatment sequences using a random number generator at randomization.com.
Statement of Ethics
Written informed consent was obtained from all participants prior to enrollment. The protocol was reviewed and approved by institutional ethics boards of the participating clinical sites. The trial was registered at clinicaltrials.gov as NCT02029833.
Dietary Intervention
This study consisted of three six-week treatment periods separated by washout periods of four to 12 weeks. During each treatment phase, participants consumed a controlled iso-caloric, full-feeding diet containing 35% fat, 50% carbohydrate, and 15% protein of total energy, as well as ~208mg/3000kcal/d cholesterol and ~38g/3000kcal/d fiber. All three phases were identical except for the type of treatment oil provided. All meals were prepared based on a seven-day rotating menu cycle in the metabolic kitchen of the participating sites. During the washout periods, participants were instructed to consume their habitual diets. To eliminate the effect of physical activity on IR, participants were requested to maintain their usual level of physical activity during the study.
Treatment oils consisted of 20% of total energy and were incorporated into two equal portions of smoothie beverages consumed at breakfast and supper. Treatment oils included: 1) regular canola oil (RCO; Canola Harvest Canola Oil, Richardson International, MB, Canada) consisted of 6.6% SFA, 65.3% MUFA, 19.6% n-6 PUFA, 8.5% α-linolenic acid, 2) high-oleic acid canola oil (HOCO; Canola Harvest Canola Oil, Richardson International, MB, Canada) consisted of 6.7% SFA, 75.9% MUFA, 14.8% n-6 PUFA, 2.6% α-linolenic acid, and 3) a high-SFA low-MUFA control oil consisted of 22.1% long-chain SFA, 18.1% medium-chain FA (MCFA), 22.0% MUFA, 29.6% n-6 PUFA, 8.2% n-3 PUFA α-linolenic acid. The high-SFA oil blend was prepared using 34.9% safflower oil (eSutras, Illinois, USA), 36.0% ghee/butter oil (Verka, New Delhi, India), 16.0% coconut oil (eSutras, Illinois, USA), and 13.1% flaxseed oil (Shape Foods, MB, Canada). Compliance was assessed by the consumption of smoothies; 90% was the required target for smoothie consumption at each phase. To ensure optimal compliance, participants were required to consume one smoothie each day under the supervision of a clinical coordinator.
Biochemical Measurements
On the first two and last two days of each treatment phase, 12-hr fasting blood samples were collected, processed, and stored at −80°C until further analyzed. Frozen samples were shipped to St. Michael’s Hospital (Toronto, ON, Canada) for analysis. Serum insulin and fructosamine were measured with the Roche/Hitachi cobas® immunoassay analyzer and electrochemiluminescence immunoassay kits (Roche Diagnostics, Laval, QC, Canada). Serum glucose was determined using cobas® enzymatic reagents on Roche/Hitachi c501e automated clinical chemistry analyzers (Roche Diagnostics, Laval, QC, Canada). The average of the last two days was calculated and used for endpoint-to-endpoint comparison in statistical analyses.
Homeostasis model assessment (HOMA)-IR and HOMA-beta cell function (β) indices were calculated using the average of the last two days via following formulas (Song et al 2007):
HOMA-IR=(Fasting insulin (μIU/ml)×Fasting glucose (mg/dl))/22.5
HOMA-β=(Fasting insulin (μIU/ml)×20)/(Fasting glucose (mg/dl))-3.5
Genotyping
Buffy coat samples of the first day of the first phase were used to extract the genomic DNA using Qiagen DNeasy Blood and Tissue Kit according to the manufacturer’s instructions (Qiagen Sciences Inc., Toronto, ON, Canada). The concentration and purity of the extracted DNA were assessed using Thermo Scientific NanoDrop 2000 micro-volume spectrophotometer (Thermo Fisher Scientific Inc., Waltham, MA, USA). TaqMan GTXpree Master Mix with allele-specific probes (Applied Biosystems, Life Technologies Inc., Burlington, ON, Canada) was used to genotype nine candidate single-nucleotide polymorphisms (SNPs) within eight genes that have been previously associated with insulin resistance. The selected genes included adiponectin (ADIPOQ); adrenoceptor beta-2 (ADRB2); fat mass and obesity-associated gene (FTO); insulin receptor substrate-1 (IRS1); liver fatty acid binding protein (FABP1); perilipin-1 (PLIN1); peroxisome proliferator-activated receptor gamma (PPARγ); transcription factor 7-like-2 (TCF7L2). The characteristics of the selected SNPs are presented in Table 1. Amplification and detection of DNA were conducted with the 7500 Fast Real-Time PCR System (Applied Biosystems, Life Technologies Inc, Burlington, ON, Canada) and StepOne 2.1 (Applied Biosystems, Life Technologies Inc., Burlington, ON, Canada). All samples were run in duplicate.
Statistical Analyses
The COMIT II sample size was calculated to detect an effect in android fat mass. Statistical analyses were performed using SAS 9.4 (SAS, Cary, NC) based on a per protocol approach. Normality was assessed using the Shapiro–Wilk test and the skewness value. Non-normally distributed variables were log-transformed before analysis. The results are expressed as least square means ± SEMs unless otherwise specified andstatistical significance was set at P-value < 0.05. PROC MIXED with repeated-measure procedure was used to assess the effect of the three dietary treatments on IR and glycemic homeostasis. Treatment, sex, age, and genotype were used as fixed effects, participants as a repeated factor. Random effects were identified as treatment sequence, clinical site, and participant. Pre-specified potential confounders such as ethnicity, baseline body composition, baseline fasting glucose level, and HOMA-IR were investigated in all models. The effects of possible gene-MUFA interactions on IR and glycemic homeostasis were assessed using the same approach. However, due to the considerably comparable MUFA concentrations in the two canola treatments compared to the high-SFA treatment, the statistical analysis of the interaction between diet and genetic polymorphism was conducted to compare the combined effect of the two MUFA diets versus the high-SFA diet. In addition to the analysis of the effect of each SNP separately, possible effects of their interaction on IR and glycemic homeostasis were also evaluated using the same approach. The Hardy-Weinberg equilibrium was assessed with χ2 test.
Results
A total of 125 participants completed the trial. Three participants were excluded due to high fasting blood glucose levels (>7.0mmol/L), and six participants were excluded due to large body weight changes (>5% endpoint-baseline weight change), therefore, 116 participants (72 women and 44 men) were included in this study of the effect of FA composition on IR and glycemic homeostasis. All participants were non-diabetic and mean HOMA-IR was above 3.0 at baseline (data not shown) as well as at endpoint of dietary interventions (Table 2). No differences were observed in fasting concentrations of glucose, insulin, or fructosamine, nor HOMA-IR or HOMA-β indices following the consumption of HOCO or RCO compared to the high-SFA treatment (Table 2).
Only 101 participants (60 women and 41 men) provided a consent for genetic analyses. The ethnicity for the majority (73%) of participants was Caucasian. Participant characteristics are presented in Table 3. Genotype-frequencies did not differ from Hardy–Weinberg equilibrium except for the ADIPOQ rs266729. The genotype associations with glycemic response to different dietary MUFA levels (Table 4) showed that consumption of the high-SFA diet induced reductions, compared to the combined high-MUFA diets, in insulin (high-SFA: 11.8 ± 3.6 and high-MUFA: 13.6 ± 3.5, p=0.04), HOMA-β (high-SFA: 151 ± 46 and high-MUFA: 178 ± 43, p=0.026), and a tendency in HOMA-IR (high-SFA: 2.6 ± 0.9 and high-MUFA: 3.1 ± 0.9, p=0.07) only in the IRS1 rs7578326-GG homozygotes. No effects of different dietary MUFA levels on IR or glycemic homeostasis were observed in the carriers of the IRS1 rs7578326-A allele. The IRS1 rs2943641 polymorphism did not modify IR or glycemic responsiveness to MUFA modification.
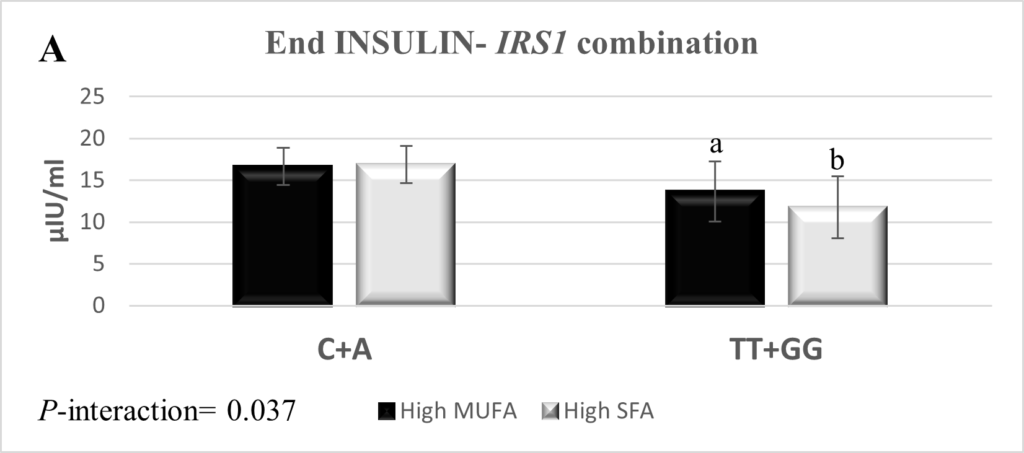
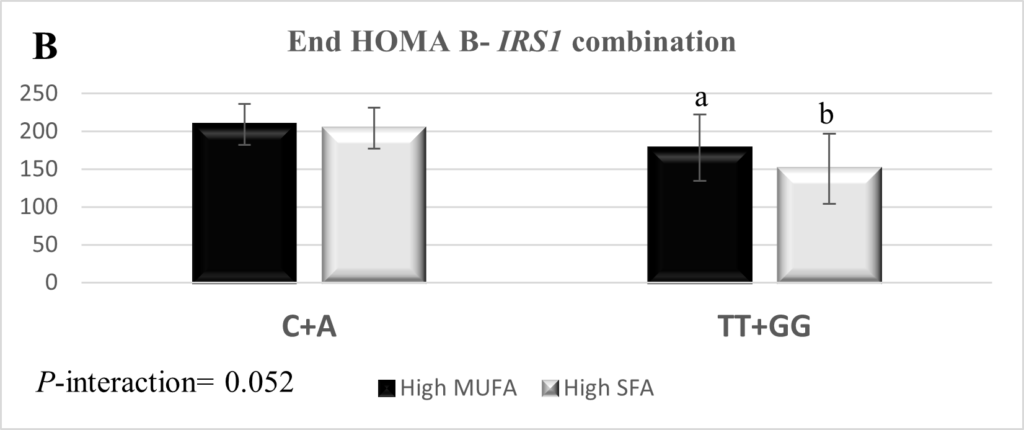
The combination of SNPs rs2943641 and rs7578326 within IRS1 was interrogated and yielded three genotype combinations; rs2943641-C + rs7578326-A (n=92), rs2943641-TT + rs7578326-A (n=2), and rs2943641-TT + rs7578326-GG (n=7). The IRS1 rs2943641-TT + rs7578326-A combination was excluded from the final statistical analysis due to low frequency. The combination of rs2943641-TT and rs7578326-GG genotypes reduced insulin high-SFA: 11.8 ± 3.7 and high-MUFA: 13.7 ± 3.6, p=0.034), HOMA-β (high-SFA: 150.7 ± 46.3 and high-MUFA: 178.3 ± 43.6, p=0.023), and HOMA-IR (high-SFA: 2.6 ± 1.0 and high-MUFA: 3.1 ± 0.9, p=0.06) levels in response to the high-SFA diet compared to higher MUFA consumption (Figure 1). Measures of IR and glycemic control did not respond to the dietary intervention in the carriers of the combination of the IRS1 rs2943641-C + rs7578326-A.
The results also revealed a reduction (high-SFA: 4.3 ± 0.9 and high-MUFA: 4.5 ± 0.8, p=0.042) in HOMA-IR and a concomitant reduction (high-SFA: 16.7 ± 3.3 and high-MUFA: 17.9 ± 3.2, p=0.06) in fasting insulin concentrations following consumption of the high-SFA diet compared to the high-MUFA diets in the FABP1 rs2241883-CC homozygotes. No significant FA-by-gene interactions were observed in the other six candidate SNPs within ADIPOQ, ADRB2, FTO, PLIN1, PPARγ, and TCF7L2 on the responses of fasting insulin, fasting glucose, HOMA-IR, and HOMA-β to dietary FA modification. Furthermore, none of the nine selected polymorphisms modulated fructosamine levels in response to dietary MUFA (data not shown).
Discussion
Genetic architecture may modulate insulin sensitivity responses to dietary FA composition. This study revealed beneficial effects of a low-MUFA high-SFA fat consumption pattern on IR measures in the IRS1 rs7578326-GG homozygotes and, for the first time, to our knowledge, in the carriers of the FABP1 rs2241883-CC genotypes compared to the high-MUFA diets. These results may, partly, explain the inter-individual variability in the responsiveness of IR to dietary FA modifications.
The current report failed to find overall favorable effects of high-MUFA consumption on IR measures in these non-diabetic subjects with abdominal obesity. Consumption of MUFA-rich diets (>20% of total energy) for three months (Vessby et al 2001) and six months (Due et al 2008) has been previously reported to ameliorate HOMA-IR compared to SFA-rich diet (>15% of total energy). However, studies with shorter durations showed contradictory results regarding the effects of MUFA on glucose homeostasis and IR (Xiao et al 2006, Lovejoy et al 2002). Therefore, the six-week duration of the current study might have been insufficient to permit identification of the proposed beneficial effect of MUFA on IR and glucose homeostasis in our participants with abdominal obesity. Further, genetic predisposition and, possibly, interactions with dietary FAs may modify the individual response to dietary intervention. For instance, even though SFA consumption has been repeatedly reported to be positively associated with IR and hyperinsulinemia (Riccardi et al 2004, Vessby et al 2001, Due et al 2008), Luan et al. showed a genetically-oriented response of fasting insulin concentrations to dietary SFA intake mediated by the PPARγ rs1801282 polymorphism (Luan et al 2001). Similarly, the present study results shed light on genetically-driven responses of IR measures to dietary FA composition.
The rs2943641 and rs7578326 polymorphisms within IRS1 have been reported to modulate IR in different ethnic populations (Qi et al 2011, Li et al 2016, Alharbi et al 2014, Rosta et al 2017). The IRS1 rs2943641 is the best-associated variant with type 2 diabetes and IR in IRS1 locus (Qi et al 2011, Yiannakouris et al 2012), and has been marked as a potential functional variant (Rung et al 2009). While the function of the IRS1 rs7578326 is not defined yet, the A-allele was found to be associated with a higher risk for type 2 diabetes (Zheng et al 2013, Yoshiuchi 2013). The latter polymorphism is located in the intron region which might impact splicing and hence the expression of the functional isoform of the IRS1 protein. The upregulation of IRS1 expression might alleviate IR and restore the impairment of insulin signaling pathways (Cheng et al 2017).
Both IRS1 variants have been reported to modulate the effects of quantity and quality of dietary macronutrients on IR and type 2 diabetes (Qi et al 2011, Zheng et al 2013, Ericson et al 2013). Zheng et al. reported that the rs7578326 and rs2943641 polymorphisms within the IRS1 gene modified IR in response to the SFA-to-carbohydrate ratio and MUFA consumption in two independent populations (Zheng et al 2013). In the present study, we found an improvement in insulin sensitivity, measured by reductions in fasting insulin, HOMA-IR, and HOMA-β, in the IRS1 rs7578326-GG genotype carriers following consumption of the high-SFA low-MUFA diet compared to the high-MUFA diets in a controlled feeding trial. This finding supports the aforementioned study by Zheng et al. which reported that the carriers of the rs7578326-G allele who consumed a low-MUFA diet incurred a significant reduction in HOMA-IR compared to the non-carriers (Zheng et al 2013); however, the reported low-MUFA consumption in their study might reflect high-SFA and/or high-PUFA. A potential mechanism of this interaction might be related to lipid-induced modulatory effect of tyrosine phosphorylation (Samuel et al 2010, Frangioudakis et al 2005); however, further research is required to reveal the mechanism(s) that coordinate the interaction between dietary FA composition and IRS1 polymorphisms on IR.
The results of this study also indicate that the homozygotes for the combination of rs2943641-TT and rs7578326-GG of IRS1 (frequency=7%) may have improved insulin sensitivity following high-SFA compared to high-MUFA consumption. The IRS1 rs7578326 is adjacent and in moderate linkage with the potential functional IRS1 rs2943641 (r2=0.79, in HapMap CEU) (Yiannakouris et al 2012). Therefore, the modulatory effect of the combined the rs2943641-TT and rs7578326-GG IRS1 genotypes on IR might suggest thatthe rs7578326 regulate insulin signaling through the functional rs2943641. This finding supports the previously reported modulatory effect of the combination of IRS1 rs7578326-G and rs2943641-T alleles on IR response to dietary intervention (Zheng et al 2013).
The functional FABP1 rs2241883 (T94A) was found to be associated with type 2 diabetes and IR (16, Xue et al 2016). The physiological role of FABP1, as a key regulator of lipid metabolism, is suggested to be optimized by the presence of threonine at the N-terminal region of the FA binding site (position 94) (Xue et al 2016, Brouillette et al 2004). The rs2241883 mutation (A94/C allele) could reduce the binding capacity of FABP1 to long-chain FA and subsequently, alter normal lipid metabolism (Xue et al 2016). However, the responsiveness of the FABP1 A94 allele to dietary FA composition has been previously reported (Robitaille et al 2004). In the current study, consumption of the high-SFA diet in the FABP1 rs2241883-CC homozygotes ameliorated IR compared to non-carriers. Actually, MCFA contributed to ~18% (10.9 g) of the high-SFA treatment of this study compared to a negligible amount in the high-MUFA treatments. The consumption of small amount of MCFAs (≤10-18 g/d) for ≤90 days has been previously reported to induce beneficial physiological effects including reductions in body weight and fat mass (Tsuji et al 2001, Kasai et al 2003), improvement in lipid profile (Kasai et al 2003), as well as amelioration of HOMA-IR (Han et al 2007). Accordingly, in this study, MCFAs could partly counteract the FABP1 rs2241883-CC genotype (A94A)-associated proposed reduction in the activity of FABP1 thus, inducing beneficial effects on IR. MCFAs, unlike long-chain FAs, are freely permeable into cells and mitochondria, therefore, a reduction in FABP1 activity may not inhibit their cellular uptake and/or metabolism as well as would reduce FA flux to the liver (Atshaves et al 201, Wein et al 2009). Consequently, we suggest that MCFAs, despite being present in small concentrations, in the high-SFA diet might improve IR by reducing FA flux to the liver in the FABP1 rs2241883-CC genotype carriers, thereby, probably overriding the effects of other SFA on glucose insulin homeostasis. To the best of our knowledge, this is the first study to evaluate the effect of FA composition-by-FABP1 rs2241883 interaction on IR, therefore, confirmatory and biochemical studies are required.
In this study, polymorphisms within ADIPOQ, ADRB2, FTO, PLIN1, PPARγ, and TCF7L2 genes failed to modulate the effect of MUFA consumption on glucose homeostasis and IR measures. However, conflicting data still exist regarding IR responsiveness to diet-by-gene interactions (Zheng et al 2015, Grau et al 2009, Warodomwichit et al 2009, Perez-Martinez et al 2008). A major strength of the present study is the crossover design with a controlled full-feeding diet and a relatively large number of participants for such a dietary intervention. In the present study, insulin resistance was assessed by HOMA-IR rather than using the gold standard euglycemic glucose clamp technique which might be considered as a limitation. However, HOMA-IR is a feasible and robust tool for the surrogate assessment of IR, especially in non-diabetic subjects, and has been validated across the clamp technique (Sarafidis et al 2007). Although the majority (73%) of study participants was Caucasian, the mixed ethnicity might be considered as another limitation; however, it might, in contrast, provide generalizability of the current findings to the population at large. Another limitation of this study is that we did not control for multiple testing, which may lead to a potential overstatement of our findings.
In conclusion, polymorphisms in FABP1 and IRS1 appeared to modulate the IR response to dietary FA composition. The observed interactions between dietary FA composition and genetic variants within FABP1 and IRS1 genes on HOMA-IR may reflect a potential clinical benefit on insulin sensitivity following prolonged exposure to dietary FA modifications. These results may eventually contribute to developing an effective genotype-based dietary recommendation to reduce the incidence and associated complications of IR and type 2 diabetes.
Acknowledgments:
We express our appreciation to the participants, the clinical coordinators, kitchen staff, laboratory staff, and nurses for making this study possible. We extend gratitude to Stephanie Jew for overseeing site-site study coordination as well as to Julia Rempel, clinical coordinator at RCFFN; Valérie Guay and Julie Maltais-Giguère, clinical coordinators at INAF; and Danielle Perera, Angela Wilson and Sandra Castillo, clinical coordinators at CCARM. Authors’ contributions: The authors’ responsibilities were as follows: SSH, JS, XC, PC, KJB, and PZ were involved in the clinical trial conducting and data collection; SSH performed the genotype analysis, data interpretation, and wrote the manuscript; PE contributed expertise for genotyping studies; PWC was responsible for the biochemical measurements; PWC, BL, SGW, PMKE, CT, DJAJ, and PJHJ designed the project and supervised the study. All authors critically reviewed the manuscript and read and approved the final version. Author disclosures: SSH, JS, PE, XC, PWC, PC, SGW, PMKE, and KJB have no conflict of interest. BL is Chair of Nutrition at Université Laval, which is supported by private endowments from Pfizer, La Banque Royale du Canada and Provigo-Loblaws. BL has received funding in the last five years from the Canadian Institutes for Health Research, the Natural Sciences and Engineering Research Council of Canada, Agriculture and Agri-Food Canada (Growing Forward program supported by the Dairy Farmers of Canada (DFC), Canola Council of Canada, Flax Council of Canada, Dow Agrosciences), Dairy Research Institute, Dairy Australia, Merck Frosst, Pfizer and Atrium Innovations. BL served as the Chair of the peer-review Expert Scientific Advisory Council of DFC. BL is also an Advisory Board member of the Canadian Nutrition Society and has received honoraria from the International Chair on Cardiometabolic risk, DFC and the World Dairy Platform as invited speaker in various conferences. CGT and PZ have received funding in the past 5 years from CIHR, NSERC, Agriculture and Agri-Food Canada (Growing Forward and the Canola/Flax Agri-Science Cluster, Pulse Agri-Science Cluster, Canada-Manitoba Agri-Food Research Development Initiative), Research Manitoba, Manitoba Energy Science and Technology, Manitoba Agri-Health Research Network, Alberta Innovates, Alberta Crop Industry Development Fund, Alberta Canola Producers Commission, Alberta Pulse, Saskatchewan Pulse Growers, Canadian Diabetes Association, and MITACS. DJAJ has received research grants from Saskatchewan Pulse Growers, the Agricultural Bioproducts Innovation Program through the Pulse Research Network, the Advanced Foods and Material Network, Loblaw Companies Ltd., Unilever, Barilla, the Almond Board of California, Agriculture and Agri-food Canada, Pulse Canada, Kellogg’s Company, Canada, Quaker Oats, Canada, Procter & Gamble Technical Centre Ltd., Bayer Consumer Care, Springfield, NJ, Pepsi/Quaker, International Nut & Dried Fruit (INC), Soy Foods Association of North America, the Coca-Cola Company (investigator initiated, unrestricted grant), Solae, Haine Celestial, the Sanitarium Company, Orafti, the International Tree Nut Council Nutrition Research and Education Foundation, the Peanut Institute, the Canola and Flax Councils of Canada, the Calorie Control Council (CCC), the CIHR, the Canada Foundation for Innovation and the Ontario Research Fund. DJAJ has received in-kind supplies for trial as a research support from the Almond board of California, Walnut Council of California, American Peanut Council, Barilla, Unilever, Unico, Primo, Loblaw Companies, Quaker (Pepsico), Pristine Gourmet, Bunge Limited, Kellogg Canada, WhiteWave Foods. DJAJ has been on the speaker’s panel, served on the scientific advisory board and/or received travel support and/or honoraria from the Almond Board of California, Canadian Agriculture Policy Institute, Loblaw Companies Ltd, the Griffin Hospital (for the development of the NuVal scoring system, the Coca-Cola Company, EPICURE, Danone, Diet Quality Photo Navigation (DQPN), FareWell, Verywell, True Health Initiative, Saskatchewan Pulse Growers, Sanitarium Company, Orafti, the Almond Board of California, the American Peanut Council, the International Tree Nut Council Nutrition Research and Education Foundation, the Peanut Institute, Herbalife International, Pacific Health Laboratories, Nutritional Fundamental for Health, Barilla, Metagenics, Bayer Consumer Care, Unilever Canada and Netherlands, Solae, Kellogg, Quaker Oats, Procter & Gamble, the Coca-Cola Company, the Griffin Hospital, Abbott Laboratories, the Canola Council of Canada, Dean Foods, the California Strawberry Commission, Haine Celestial, PepsiCo, the Alpro Foundation, Pioneer Hi-Bred International, DuPont Nutrition and Health, Spherix Consulting and WhiteWave Foods, the Advanced Foods and Material Network, the Canola and Flax Councils of Canada, the Nutritional Fundamentals for Health, Agri-Culture and Agri-Food Canada, the Canadian Agri-Food Policy Institute, Pulse Canada, the Saskatchewan Pulse Growers, the Soy Foods Association of North America, the Nutrition Foundation of Italy (NFI), Nutra-Source Diagnostics, the McDougall Program, the Toronto Knowledge Translation Group (St. Michael’s Hospital), the Canadian College of Naturopathic Medicine, The Hospital for Sick Children, the Canadian Nutrition Society (CNS), the American Society of Nutrition (ASN), Arizona State University, Paolo Sorbini Foundation and the Institute of Nutrition, Metabolism and Diabetes. He received an honorarium from the United States Department of Agriculture to present the 2013 W.O. Atwater Memorial Lecture. DJAJ received the 2013 Award for Excellence in Research from the International Nut and Dried Fruit Council. DJAJ received funding and travel support from the Canadian Society of Endocrinology and Metabolism to produce mini cases for the Canadian Diabetes Association (CDA). DJAJ is a member of the International Carbohydrate Quality Consortium (ICQC). His wife, ALJ, is a director and partner of Glycemic Index Laboratories, Inc., and his sister received funding through a grant from the St. Michael’s Hospital Foundation to develop a cookbook for one of his studies. PJHJ’s research related to a variety of oils and fats has been supported by grants and contracts from both industry and non-industry sources, including the Canola Council of Canada, Dairy Farmers of Canada, Canadian Institutes for Health Research, Natural Sciences and Engineering Research Council of Canada, Heart and Stroke Foundation of Canada, and National Institutes of Health Rare Diseases Network. PJHJ also serves as a committee member for the Soy Nutrition Institute, and the North American International Life Sciences Institute’s Lipids Committee. PJHJ is President of Nutritional Fundamentals for Health Inc., which markets functional foods and nutraceuticals and provides support to the CJNM. The funding agencies played no role in defining the study design; in the collection, analysis, and interpretation of data; in the writing of the manuscript; or in the decision to submit the manuscript for publication.
References
Alharbi KK, Khan IA, Munshi A, Alharbi FK, Al-Sheikh Y, Alnbaheen MS. Association of the genetic variants of insulin receptor substrate 1 (IRS-1) with type 2 diabetes mellitus in a Saudi population. Endocrine 2014;47(2):472-477.
Atshaves BP, Martin GG, Hostetler HA, McIntosh AL, Kier AB, Schroeder F. Liver fatty acid-binding protein and obesity. J Nutr Biochem 2010;21(11):1015-1032.
Brown AE, Walker M. Genetics of Insulin Resistance and the Metabolic Syndrome. Curr Cardiol Rep 2016;18(8):75.
Brouillette C, Bosse Y, Perusse L, Gaudet D, Vohl MC. Effect of liver fatty acid binding protein (FABP) T94A missense mutation on plasma lipoprotein responsiveness to treatment with fenofibrate. J Hum Genet 2004;49(8):424-432.
Chang LF, Vethakkan SR, Nesaretnam K, Sanders TA, Teng KT. Adverse effects on insulin secretion of replacing saturated fat with refined carbohydrate but not with monounsaturated fat: A randomized controlled trial in centrally obese subjects. J Clin Lipidol 2016;10(6):1431-1441.
Cheng L, Song J, Li G, Liu Y, Wang Y, Meng X, Sun G, Sun X. Effects of the Tangningtongluo formula as an alternative strategy for diabetics via upregulation of insulin receptor substrate-1. Mol Med Rep 2017;16(1):703-709.
Corella D, Qi L, Tai ES, Deurenberg-Yap M, Tan CE, Chew SK, Ordovas JM. Perilipin gene variation determines higher susceptibility to insulin resistance in Asian women when consuming a high-saturated fat, low-carbohydrate diet. Diabetes Care 2006;29(6):1313-1319.
Due A, Larsen TM, Hermansen K, Stender S, Holst JJ, Toubro S, Martinussen T, Astrup A. Comparison of the effects on insulin resistance and glucose tolerance of 6-mo high-monounsaturated-fat, low-fat, and control diets. Am J Clin Nutr 2008;87(4):855-862.
Ericson U, Rukh G, Stojkovic I, Sonestedt E, Gullberg B, Wirfalt E, Wallstrom P, Orho-Melander M. Sex-specific interactions between the IRS1 polymorphism and intakes of carbohydrates and fat on incident type 2 diabetes. Am J Clin Nutr 2013;97(1):208-216.
Errazuriz I, Dube S, Slama M, Visentin R, Nayar S, O’Connor H, Cobelli C, Das SK, Basu A, Kremers WK, Port J, Basu, R. Randomized Controlled Trial of a MUFA or Fiber-Rich Diet on Hepatic Fat in Prediabetes. J Clin Endocrinol Metab 2017;102(5):1765-1774.
Fall T, Ingelsson E. Genome-wide association studies of obesity and metabolic syndrome. Mol Cell Endocrinol 2014;382(1):740-7457.
Frangioudakis G, Ye JM, Cooney GJ. Both saturated and n-6 polyunsaturated fat diets reduce phosphorylation of insulin receptor substrate-1 and protein kinase B in muscle during the initial stages of in vivo insulin stimulation. Endocrinology 2005;146(12):5596-5603.
Galgani JE, Uauy RD, Aguirre CA, Diaz EO. Effect of the dietary fat quality on insulin sensitivity. Br J Nutr 2008;100(3):471-479.
Grau K, Hansen T, Holst C, Astrup A, Saris WH, Arner P, Rossner S, Macdonald I, Polak J, Oppert JM, Langin D, Martinez JA, Pederson, O, Sorenson TIA. Macronutrient-specific effect of FTO rs9939609 in response to a 10-week randomized hypo-energetic diet among obese Europeans. Int J Obes (Lond) 2009;33(11):1227-1234.
Haghighatdoost F, Hosseinzadeh-Attar MJ, Kabiri A, Eshraghian M, Esmaillzadeh A. Effect of substituting saturated with monounsaturated fatty acids on serum visfatin levels and insulin resistance in overweight women: a randomized cross-over clinical trial. Int J Food Sci Nutr 2012;63(7):772-7781.
Han JR, Deng B, Sun J, Chen CG, Corkey BE, Kirkland JL, Ma J, Guo W. Effects of dietary medium-chain triglyceride on weight loss and insulin sensitivity in a group of moderately overweight free-living type 2 diabetic Chinese subjects. Metabolism 2007;56(7):985-991.
Kasai M, Nosaka N, Maki H, Negishi S, Aoyama T, Nakamura M, Suzuki Y, Tsuji H, Uto H, Okazaki M, Kondo K. Effect of dietary medium- and long-chain triacylglycerols (MLCT) on accumulation of body fat in healthy humans. Asia Pac J Clin Nutr 2003;12(2):151-160.
Li Q, Qiao Y, Wang C, Zhang G, Zhang X, Xu L. Associations between two single-nucleotide polymorphisms (rs1801278 and rs2943641) of insulin receptor substrate 1 gene and type 2 diabetes susceptibility: a meta-analysis. Endocrine 2016;51(1):52-62.
Lovejoy JC. The influence of dietary fat on insulin resistance. Curr Diab Rep 2002;2(5):435-440.
Lovejoy JC, Smith SR, Champagne CM, Most MM, Lefevre M, DeLany JP, Denkins YM, Rood JC, Veldhuis J, Bray GA. Effects of diets enriched in saturated (palmitic), monounsaturated (oleic), or trans (elaidic) fatty acids on insulin sensitivity and substrate oxidation in healthy adults. Diabetes Care 2002;25(8):1283-1288.
Luan J, Browne PO, Harding AH, Halsall DJ, O’Rahilly S, Chatterjee VK, Wareham NJ. Evidence for gene-nutrient interaction at the PPARgamma locus. Diabetes 2001;50(3):686-689.
Mansego ML, Martinez F, Martinez-Larrad MT, Zabena C, Rojo G, Morcillo S, Soriguer F, Martin-Escudero JC, Serrano-Rios M, Redon J, Chaves FJ. Common variants of the liver fatty acid binding protein gene influence the risk of type 2 diabetes and insulin resistance in Spanish population. PLoS One 2012;7(3):e31853.
McIntosh AL, Huang H, Storey SM, Landrock KK, Landrock D, Petrescu AD, Gupta S, Atshaves BP, Kier AB, Schroeder F. Human FABP1 T94A variant impacts fatty acid metabolism and PPAR-alpha activation in cultured human female hepatocytes. Am J Physiol Gastrointest Liver Physiol 2014;307(2):G164-176.
Newberry EP, Xie Y, Kennedy SM, Luo J, Davidson NO. Protection against Western diet-induced obesity and hepatic steatosis in liver fatty acid-binding protein knockout mice. Hepatology 2006;44(5):1191-1205.
Paniagua JA, Gallego de la Sacristana A, Romero I, Vidal-Puig A, Latre JM, Sanchez E, Perez-Martinez P, Lopez-Miranda J, Perez-Jimenez F. Monounsaturated fat-rich diet prevents central body fat distribution and decreases postprandial adiponectin expression induced by a carbohydrate-rich diet in insulin-resistant subjects. Diabetes Care 2007;30(7):1717-1723.
Perez-Martinez P, Lopez-Miranda J, Cruz-Teno C, Delgado-Lista J, Jimenez-Gomez Y, Fernandez JM, Gomez MJ, Marin C, Perez-Jimenez F, Ordovas JM. Adiponectin gene variants are associated with insulin sensitivity in response to dietary fat consumption in Caucasian men. J Nutr 2008;138(9):1609-1614.
Qi Q, Bray GA, Smith SR, Hu FB, Sacks FM, Qi L. Insulin receptor substrate 1 gene variation modifies insulin resistance response to weight-loss diets in a 2-year randomized trial: the Preventing Overweight Using Novel Dietary Strategies (POUNDS LOST) trial. Circulation 2011;124(5):563-571.
Riccardi G, Giacco R, Rivellese AA. Dietary fat, insulin sensitivity and the metabolic syndrome. Clin Nutr 2004;23(4):447-456.
Robitaille J, Brouillette C, Lemieux S, Perusse L, Gaudet D, Vohl MC. Plasma concentrations of apolipoprotein B are modulated by a gene–diet interaction effect between the LFABP T94A polymorphism and dietary fat intake in French-Canadian men. Mol Genet Metab 2004;82(4):296-303.
Rosta K, Al-Aissa Z, Hadarits O, Harreiter J, Nadasdi A, Kelemen F, Bancher-Todesca D, Komlosi Z, Nemeth L, Rigo J, Jr., Sziller, I, Somogyi A, Kautzky-Willer A, Firneisz G. Association Study with 77 SNPs Confirms the Robust Role for the rs10830963/G of MTNR1B Variant and Identifies Two Novel Associations in Gestational Diabetes Mellitus Development. PLoS One 2017;12(1):e0169781.
Rung J, Cauchi S, Albrechtsen A, Shen L, Rocheleau G, Cavalcanti-Proenca C, Bacot F, Balkau B, Belisle A, Borch-Johnsen K, Charpentier G, Dina C, Durand E, Elliott P, Hadjadj S, Jarvelin MR, Laitinen J, Lauritzen T, Marre M, Mazur A, Meyre D, Montpetit A, Pisinger C, Posner B, Poulsen P, Pouta A, Prentki M, Ribel-Madsen R, Ruokonen A, Sandbaek A, Serre D, Tichet J, Vaxillaire M, Wojtaszewski JFP, Vaag A, Hansen T, Polychronakos C, Pedersen O, Froguel P, Sladek R. Genetic variant near IRS1 is associated with type 2 diabetes, insulin resistance and hyperinsulinemia. Nat Genet 2009;41(10):1110-1115.
Samuel VT, Petersen KF, Shulman GI. Lipid-induced insulin resistance: unravelling the mechanism. Lancet 2010;375(9733):2267-2277.
Sarafidis PA, Lasaridis AN, Nilsson PM, Pikilidou MI, Stafilas PC, Kanaki A, Kazakos K, Yovos J, Bakris GL. Validity and reproducibility of HOMA-IR, 1/HOMA-IR, QUICKI and McAuley’s indices in patients with hypertension and type II diabetes. J Hum Hypertens 2007;21(9):709-716.
Sesti G, Federici M, Hribal ML, Lauro D, Sbraccia P, Lauro R. Defects of the insulin receptor substrate (IRS) system in human metabolic disorders. Faseb j 2001;15(12):2099-2111.
Song Y, Manson JAE, Tinker L, Howard BV, Kuller LH, Nathan L, Rifai N, Liu S. Insulin Sensitivity and Insulin Secretion Determined by Homeostasis Model Assessment (HOMA) and Risk of Diabetes in a Multiethnic Cohort of Women: The Women’s Health Initiative Observational Study. Diabetes Care 2007;30(7):1747-1752.
Tsuji H, Kasai M, Takeuchi H, Nakamura M, Okazaki M, Kondo K. Dietary medium-chain triacylglycerols suppress accumulation of body fat in a double-blind, controlled trial in healthy men and women. J Nutr 2001;131(11):2853-2859.
Turner N, Hariharan K, TidAng J, Frangioudakis G, Beale SM, Wright LE, Zeng XY, Leslie SJ, Li JY, Kraegen EW, Cooney GJ, Ye JM. Enhancement of muscle mitochondrial oxidative capacity and alterations in insulin action are lipid species dependent: potent tissue-specific effects of medium-chain fatty acids. Diabetes 2009;58(11):2547-2554.
Vessby B, Uusitupa M, Hermansen K, Riccardi G, Rivellese AA, Tapsell LC, Nalsen C, Berglund L, Louheranta A, Rasmussen BM, Calvert GD, Maffetone A, Pedersen E, Gustafsson IB, Storlien LH. Substituting dietary saturated for monounsaturated fat impairs insulin sensitivity in healthy men and women: The KANWU Study. Diabetologia 2001;44(3):312-319.
Warodomwichit D, Shen J, Arnett DK, Tsai MY, Kabagambe EK, Peacock JM, Hixson JE, Straka RJ, Province MA, An P, Lai CQ, Parnell LD, Borecki IB, Ordovas JM. ADIPOQ polymorphisms, monounsaturated fatty acids, and obesity risk: the GOLDN study. Obesity (Silver Spring) 2009;17(3):510-517.
Wein S, Wolffram S, Schrezenmeir J, Gasperikova D, Klimes I, Sebokova E. Medium-chain fatty acids ameliorate insulin resistance caused by high-fat diets in rats. Diabetes Metab Res Rev 2009;25(2):185-194.
Xiao C, Giacca A, Carpentier A, Lewis GF. Differential effects of monounsaturated, polyunsaturated and saturated fat ingestion on glucose-stimulated insulin secretion, sensitivity and clearance in overweight and obese, non-diabetic humans. Diabetologia 2006;49(6):1371-1379.
Xue H, Zhao H, Liu X, Zhao YR, Chen ZJ, Ma J. Association of single-nucleotide polymorphisms rs2197076 and rs2241883 of FABP1 gene with polycystic ovary syndrome. J Assist Reprod Genet 2016;33(1):75-83.
Yiannakouris N, Cooper JA, Shah S, Drenos F, Ireland HA, Stephens JW, Li KW, Elkeles R, Godsland IF, Kivimaki M, Hingorani AD, Kumari M, Talmud PJ, Humphries SE. IRS1 gene variants, dysglycaemic metabolic changes and type-2 diabetes risk. Nutr Metab Cardiovasc Dis 2012;22(12):1024-1030.
Yoshiuchi I. Evidence of selection at insulin receptor substrate-1 gene loci. Acta Diabetol 2013;50(5):775-779.
Zheng JS, Arnett DK, Parnell LD, Smith CE, Li D, Borecki IB, Tucker KL, Ordovas JM, Lai CQ. Modulation by dietary fat and carbohydrate of IRS1 association with type 2 diabetes traits in two populations of different ancestries. Diabetes Care 2013;36(9):2621-2627.
Zheng Y, Huang T, Zhang X, Rood J, Bray GA, Sacks FM, Qi L. Dietary Fat Modifies the Effects of FTO Genotype on Changes in Insulin Sensitivity. J Nutr 2015;145(5):977-982.
Table 1: Characteristics of the Selected Polymorphisms
| Full name of gene | Gene | SNP | Region | Allele | Genotype (N) | MAF% | ||
| Major/minor | MM | Mm | mm | |||||
| Adiponectin | ADIPOQ | rs266729 | Exon/ 5′ UTR | C/G | 61 | 30 | 10 | 24.8 |
| Adrenoceptor Beta-2 | ADRB2 | rs1042714 | Exon | C/G | 42 | 41 | 18 | 38.1 |
| Fat mass and obesity-associated gene | FTO | rs9939609 | Intron | T/A | 44 | 39 | 18 | 37.1 |
| Insulin receptor substrate-1 | IRS1 | rs2943641 | Intergene | C/T | 50 | 42 | 9 | 29.7 |
| rs7578326 | Intron | A/G | 49 | 45 | 7 | 29.2 | ||
| Liver fatty acid binding protein | FABP1 | rs2241883 | Missense | T/C | 46 | 45 | 10 | 32.2 |
| Perilipin-1 | PLIN1 | rs894160 | Intron | C/T | 47 | 43 | 11 | 32.2 |
| Peroxisome proliferator-activated receptor gamma | PPARγ | rs1801282 | Missense | C/G | 78 | 21 | 2 | 12.4 |
| Transcription factor 7-like-2 | TCF7L2 | rs7903146 | Intron | C/T | 48 | 46 | 7 | 29.7 |
Table 2: Fasting Insulin, Glucose, Fructosamine, and Homeostatic Model Assessment of Insulin Sensitivity and Β-Cell Function According to Dietary Intervention1
| Variable | Total (n=116) | Female (n=72) | Male (n=44) | ||||||||
| HOCO | RCO | Control | P2 | HOCO | RCO | Control | HOCO | RCO | Control | Pa | |
| Insulin (μIU/ml) | 16.5 ± 2.4 | 16.4 ± 2.4 | 16.8 ± 2.4 | 0.89 | 16.1 ± 2.5 | 15.7 ± 2.5 | 16.2 ± 2.5 | 16.9 ± 2.6 | 17.2 ± 2.6 | 17.4 ± 2.6 | 0.28 |
| Glucose (mg/dl) | 93.9 ± 1.1 | 93.3 ± 1.1 | 94.5 ± 1.1 | 0.08 | 93.7 ± 1.3 | 92.9 ± 1.3 | 94.0 ± 1.3 | 94.1 ± 1.6 | 93.7 ± 1.5 | 5.3 ± 1.5 | 0.80 |
| Fructosamine (μmol/l) | 224.3 ± 2.3 | 223.8 ± 2.3 | 224.7 ± 2.3 | 0.63 | 220.9 ± 2.5 | 219.5 ± 2.5 | 220.6 ± 2.5 | 227.8 ± 2.9 | 228.2 ± 2.9 | 228.7 ± 2.9 | 0.63 |
| HOMA-IR | 3.89 ± 0.57 | 3.84 ± 0.57 | 4.00 ± 0.57 | 0.72 | 3.81 ± 0.59 | 3.70 ± 0.59 | 3.89 ± 0.59 | 3.96 ± 0.64 | 3.98 ± 0.64 | 4.10 ± 0.64 | 0.31 |
| HOMA-β | 203.7 ± 31.1 | 208.3 ±31.1 | 198.9 ± 31.1 | 0.45 | 196.4 ± 31.9 | 193.3 ±31.9 | 194.6 ± 31.9 | 211.1 ± 33.5 | 223.3 ±33.5 | 203.1 ±33.5 | 0.43 |
2SAS PROC MIXED with repeated measure procedure was used to assess the effect of MUFA consumption on the reported glycemic control-related measures, using participants as a repeated factor. Treatment, sex, age, and genotype were used as fixed effects. Random effects were treatment sequence, clinical site, and participants. P<0.05 was considered significant. P: the difference between the treatments in the overall population. Pa: P of gender-by-treatment interaction.
Table 3: Characteristics of Participants at the Baseline of Dietary Intervention1
| Characteristic | Total (n=101) | Female (n=60) | Male (n=41) | P2 |
| Age (years) | 43.31 ± 1.29 | 45.65 ± 1.64 | 39.88 ± 1.98 | 0.0271 |
| Ethnicity (n) | – | |||
| Caucasian | 74 | 45 | 29 | |
| African | 4 | 3 | 1 | |
| Asian | 8 | 4 | 4 | |
| Hispanic | 3 | 1 | 2 | |
| Others | 12 | 7 | 5 | |
| Waist circumference (cm) | 103.8 ± 1.3 | 100.8 ± 1.6 | 108.3 ± 1.9 | 0.003 |
| Body weight (kg) | 89.76 ± 1.88 | 83.05 ± 2.21 | 99.59 ± 2.67 | <.0001 |
| BMI3 (kg/m2) | 31.12 ± 0.53 | 30.99 ± 0.69 | 31.31 ± 0.84 | 0.7675 |
| Systolic BP (mmHg) | 118.6 ± 1.3 | 117.8 ± 1.7 | 119.7 ± 2.0 | 0.4647 |
| Diastolic BP (mmHg) | 78.10 ± 1.08 | 77.47 ± 1.41 | 79.00 ± 1.70 | 0.4915 |
| Total cholesterol (mmol/L) | 5.19 ± 0.09 | 5.21 ± 0.12 | 5.15 ± 0.14 | 0.7369 |
| Triglycerides (mmol/L) | 1.55 ± 0.07 | 1.46 ± 0.09 | 1.67 ± 0.11 | 0.1523 |
| HDL-cholesterol (mmol/L) | 1.35 ± 0.04 | 1.46 ± 0.04 | 1.20 ± 0.05 | 0.0003 |
| LDL-cholesterol (mmol/L) | 3.13 ± 0.08 | 3.09 ± 0.10 | 3.19 ± 0.12 | 0.5063 |
| Glucose (mg/dl) | 94.0 ± 0.7 | 93.8 ± 1.1 | 94.1 ± 1.3 | 0.8271 |
| Insulin (μIU/ml) | 14.21 ± 0.88 | 13.58 ± 1.14 | 15.12 ± 1.38 | 0.3908 |
| HOMA IR | 3.89 ± 0.27 | 3.71 ± 0.35 | 4.15 ± 0.43 | 0.4283 |
| HOMA-β | 196.5 ± 10.5 | 189.9 ± 13.6 | 206.1 ± 16.4 | 0.4508 |
2SAS PROC MIXED procedure was used to assess the inter-sex differences, P<0.05 was considered significant. SAS PROC MEANS was used to determine the mean characteristics of the overall population.
3BP: blood pressure; BMI: body mass index; HDL: high-density lipoprotein; LDL: low-density lipoprotein; HOMA-β: homeostasis model assessment of beta-cell function; HOMA-IR: homeostasis model assessment of insulin resistance.
Table 4: Fasting Insulin, Glucose, and Homeostatic Model Assessment of Insulin Sensitivity and Β-Cell Function According to Dietary Intervention and Selected Polymorphisms1
| Insulin (μIU/ml) | Glucose (mg/dl) | HOMA-IR | HOMA-β | ||||||||||
| Gene, SNP | Allele (n) | High MUFA | Low MUFA | P2 | High MUFA | Low MUFA | P | High MUFA | Low MUFA | P | High MUFA | Low MUFA | P |
| ADIPOQ rs266729 | CC (61) | 16.5 ± 2.3 | 17.0 ± 2.3 | 93.4 ± 1.3 | 94.7 ± 1.3 | 3.8 ± 0.6 | 4.1 ± 0.6 | 208 ± 29 | 199 ± 29 | ||||
| CG (30) | 15.9 ± 2.5 | 15.1 ± 2.6 | 0.42 | 91.7 ± 1.6 | 90.9 ± 1.7 | 0.08 | 3.6 ± 0.6 | 3.4 ± 0.6 | 0.29 | 208 ± 31 | 211 ± 32 | 0.74 | |
| GG (10) | 17.6 ± 3.2 | 17.8 ± 3.3 | 95.4 ± 2.6 | 97.3 ± 2.8 | 4.3 ± 0.8 | 4.4 ± 0.8 | 194 ± 39 | 184 ± 41 | |||||
| ADRB2 rs1042714 | CC (42) | 16.0 ± 2.4 | 16.3 ± 2.4 | 94.7 ± 1.4 | 95.3 ± 1.5 | 3.8 ± 0.6 | 3.9 ± 0.6 | 184 ± 28 | 178 ± 29 | ||||
| CG (41) | 17.4 ± 2.4 | 17.3 ± 2.4 | 0.84 | 93.5 ± 1.4 | 94.0 ± 1.5 | 0.82 | 4.1 ± 0.6 | 4.1 ± 0.6 | 0.79 | 215 ± 28 | 209 ± 29 | 1.00 | |
| GG (18) | 15.2 ± 2.8 | 15.6 ± 2.8 | 88.6 ± 2.0 | 90.1 ± 2.1 | 3.4 ± 0.7 | 3.5 ± 0.7 | 235 ± 33 | 233 ± 34 | |||||
| FABP1 rs2241883 | CC (10) | 17.9 ± 3.2 | 16.7 ± 3.3‡ | 97.6 ± 2.7 | 95.3 ± 2.8 | 4.5 ± 0.8 | 4.3 ± 0.9* | 180 ± 39 | 171 ± 41 | ||||
| TC (45) | 15.5 ± 2.4 | 16.0 ± 2.4 | 0.14 | 92.2 ± 1.4 | 93.4 ± 1.4 | 0.06 | 3.6 ± 0.6 | 3.7 ± 0.6 | 0.08 | 203 ± 29 | 197 ± 30 | 0.95 | |
| TT (46) | 17.0 ± 2.4 | 17.2 ± 2.4 | 92.9 ± 1.4 | 93.9 ± 1.4 | 3.9 ± 0.6 | 4.0 ± 0.6 | 216 ± 29 | 212 ± 30 | |||||
| FTO rs9939609 | AA (18) | 18.6 ± 2.9 | 17.7 ± 2.9 | 91.2 ± 2.1 | 92.3 ± 2.2 | 4.2 ± 0.7 | 4.0 ± 0.7 | 268 ± 36 | 232 ± 37 | ||||
| AT (39) | 15.5 ± 2.5 | 15.3 ± 2.5 | 0.76 | 94.5 ± 1.5 | 95.3 ± 1.6 | 0.84 | 3.7 ± 0.6 | 3.7 ± 0.6 | 0.84 | 177 ± 32 | 170 ± 33 | 0.38 | |
| TT (44) | 16.5 ± 2.5 | 17.4 ± 2.5 | 92.7 ± 1.5 | 93.2 ± 1.5 | 3.8 ± 0.6 | 4.1 ± 0.6 | 210 ± 31 | 218 ± 32 | |||||
| IRS1 rs2943641 | CC (50) | 16.2 ± 2.3 | 15.7 ± 2.4 | 92.5 ± 1.4 | 92.8 ± 1.4 | 3.8 ± 0.6 | 3.6 ± 0.6 | 204 ± 28 | 192 ± 29 | ||||
| CT (42) | 17.1 ± 2.4 | 18.3 ± 2.4 | 0.13 | 93.9 ± 1.4 | 95.2 ± 1.5 | 0.72 | 4.0 ± 0.6 | 4.4 ± 0.6 | 0.13 | 213 ± 29 | 218 ± 29 | 0.27 | |
| TT (9) | 13.8 ± 3.3 | 13.1 ± 3.4 | 92.7 ± 2.8 | 93.0 ± 3.0 | 3.1 ± 0.9 | 2.9 ± 0.9 | 173 ± 40 | 161 ± 43 | |||||
| IRS1 rs7578326 | AA (49) | 15.4 ± 2.3 | 14.6 ± 2.3 | 92.8 ± 1.4 | 93.1 ± 1.4 | 3.6 ± 0.6 | 3.4 ± 0.6 | 194 ± 28 | 181 ± 29 | ||||
| AG (45) | 17.7 ± 2.3 | 19.2 ± 2.3 | 0.01 | 93.7 ± 1.4 | 94.8 ± 1.5 | 0.87 | 4.2 ± 0.6 | 4.6 ± 0.6 | 0.02 | 221 ± 28 | 228 ± 29 | 0.03 | |
| GG (7) | 13.6 ± 3.5 | 11.8 ± 3.6* | 91.9 ± 3.2 | 92.5 ± 3.3 | 3.1 ± 0.9 | 2.6 ± 0.9‡ | 178 ± 43 | 151 ± 46* | |||||
| PLIN rs894160 | CC (47) | 16.4 ± 2.4 | 16.5 ± 2.4 | 94.2 ± 1.4 | 94.8 ± 1.5 | 3.8 ± 0.6 | 3.9 ± 0.6 | 196 ± 28 | 191 ± 29 | ||||
| CT (43) | 16.9 ± 2.4 | 16.8 ± 2.4 | 0.57 | 92.0 ± 1.4 | 92.7 ± 1.5 | 0.78 | 3.9 ± 0.6 | 4.0 ± 0.6 | 0.55 | 222 ± 28 | 214 ± 29 | 0.88 | |
| TT (11) | 14.9 ± 3.1 | 16.1 ± 3.2 | 93.5 ± 2.5 | 95.0 ± 2.7 | 3.4 ± 0.8 | 3.8 ± 0.8 | 183 ± 37 | 185 ± 39 | |||||
| PPARγ rs1801282 | CC (78) | 16.0 ± 2.3 | 16.3 ± 2.3 | 92.2 ± 1.0 | 92.7 ± 1.1 | 3.7 ± 0.6 | 3.8 ± 0.6 | 208 ± 28 | 205 ± 28 | ||||
| CG (21) | 17.4 ± 2.7 | 17.1 ± 2.8 | 0.54 | 95.5 ± 1.8 | 96.7 ± 1.9 | 0.72 | 4.1 ± 0.7 | 4.1 ± 0.7 | 0.66 | 201 ± 33 | 187 ± 34 | 0.36 | |
| GG (2) | 21.3 ± 5.9 | 21.1 ± 6.1 | 105.0 ± 5.6 | 107.7 ± 5.9 | 5.6 ± 1.6 | 5.6 ± 1.6 | 193 ± 71 | 176 ± 77 | |||||
| TCF7L2 rs7903146 | CC (48) | 15.8 ± 2.4 | 15.7 ± 2.4 | 92.1 ± 1.3 | 92.2 ± 1.3 | 3.6 ± 0.6 | 3.6 ± 0.6 | 198 ± 29 | 200 ± 30 | ||||
| CT (46) | 17.0 ± 2.4 | 17.7 ± 2.4 | 0.95 | 94.2 ± 1.3 | 95.5 ± 1.4 | 0.31 | 4.0 ± 0.6 | 4.3 ± 0.6 | 0.97 | 215 ± 30 | 204 ± 30 | 0.38 | |
| TT (7) | 17.8 ± 3.6 | 16.0 ± 3.7 | 93.9 ± 3.1 | 95.5 ± 3.2 | 4.2 ± 0.9 | 3.7 ± 1.0 | 209 ± 44 | 189 ± 47 |
2SAS PROC MIXED with repeated measure procedure was used to assess the effect of gene-MUFA interactions on glycemic homeostasis and HOMA indices, using participants as a repeated factor. Treatment, sex, age, and genotype were used as fixed effects. Random effects were treatment sequence, clinical site, and participants. P <0.05 was considered significant. P-values presented in the table refer to overall gene-diet interaction. * Indicates significant difference between the consumption of high-SFA versus high-MUFA within the same genotype. ‡Indicates trend toward significance (p<0.07) between the consumption of high-SFA versus high-MUFA within the same genotype.